OPEN-SOURCE SCRIPT
DDDDD: SET50 (40 Stocks) - % New 52W Lows
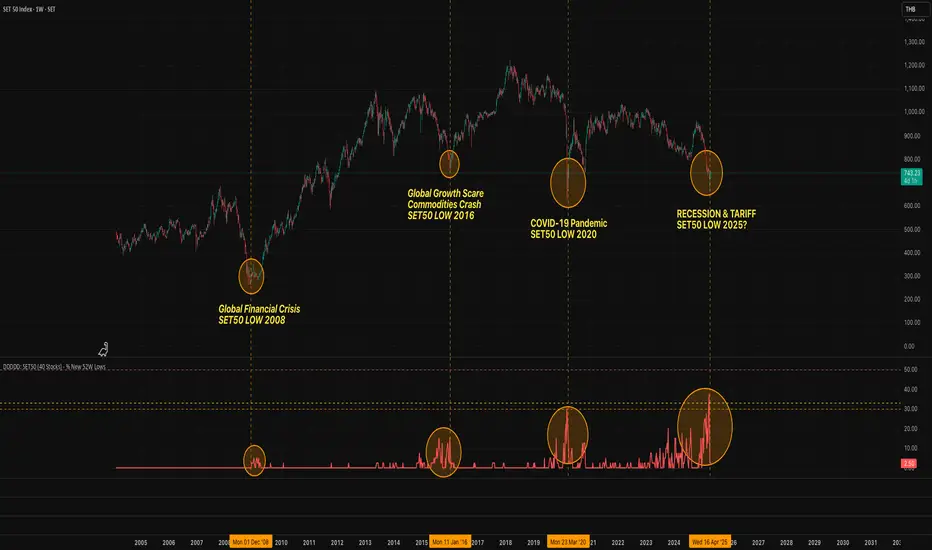
DDDDD: SET50 - % New 52W Lows (40 Stocks)
This indicator measures the percentage of selected SET50 stocks making a new 52-week low, helping identify periods of extreme market fear that often align with long-term buying opportunities.
How It Works:
Tracks the daily closing prices of 40 major SET50 constituents.
A stock is counted when it closes at its lowest price over the past 252 trading days (approximately 1 year).
Calculates the percentage of new 52-week lows relative to 40 stocks.
Displays threshold lines to highlight levels of market panic.
📈 Threshold Levels:
Threshold Line Color Level (%) Interpretation Action
30% Threshold Orange 30% Early signs of stress Start monitoring opportunities
33% Threshold Yellow 33% Confirmed panic Consider gradual accumulation
50% Panic Zone Red 50% Extreme market panic Aggressive accumulation zone
📌 Important Notes:
Why not use the full 50 stocks?
Due to TradingView Pine Script's current technical limits, a script cannot request data for more than 40 symbols efficiently.
Therefore, this indicator uses 40 representative SET50 stocks to ensure optimal performance without exceeding system limits.
The selected stocks are diversified across major sectors to maintain reliability.
🔥 Key Insights:
Historically, spikes above 30%-50% of stocks making new lows have coincided with major market bottoms (e.g., 2011, 2020).
Higher simultaneous new lows = stronger potential for long-term recovery.
Mã nguồn mở
Theo đúng tinh thần TradingView, tác giả của tập lệnh này đã công bố nó dưới dạng mã nguồn mở, để các nhà giao dịch có thể xem xét và xác minh chức năng. Chúc mừng tác giả! Mặc dù bạn có thể sử dụng miễn phí, hãy nhớ rằng việc công bố lại mã phải tuân theo Nội quy.
Thông báo miễn trừ trách nhiệm
Thông tin và các ấn phẩm này không nhằm mục đích, và không cấu thành, lời khuyên hoặc khuyến nghị về tài chính, đầu tư, giao dịch hay các loại khác do TradingView cung cấp hoặc xác nhận. Đọc thêm tại Điều khoản Sử dụng.