OPEN-SOURCE SCRIPT
Cập nhật US Liquidity-Weighted Business Cycle
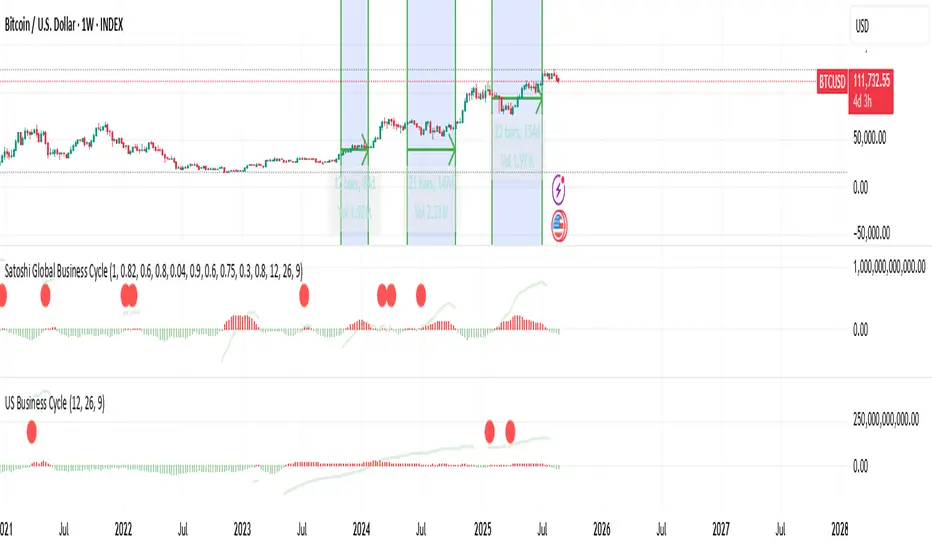
📈 BTC Liquidity-Weighted Business Cycle
This indicator models the Bitcoin macro cycle by comparing its logarithmic price against a log-transformed liquidity proxy (e.g., US M2 Money Supply). It helps visualize cyclical tops and bottoms by measuring the relative expansion of Bitcoin price versus fiat liquidity.
🧠 How It Works:
Transforms both BTC and M2 using natural logarithms.
Computes a liquidity ratio: log(BTC) – log(M2) (i.e., log(BTC/M2)).
Runs MACD on this ratio to extract business cycle momentum.
Plots:
🔴 Histogram bars showing cyclical growth or contraction.
🟢 Top line to track the relative price-to-liquidity trend.
🔴 Cycle peak markers to flag historical market tops.
⚙️ Inputs:
Adjustable MACD lengths
Toggle for liquidity trend line overlay
🔍 Use Cases:
Identifying macro cycle tops and bottoms
Timing long-term Bitcoin accumulation or de-risking
Confirming global liquidity's influence on BTC price movement
Note: This version currently uses US M2 (FRED:M2SL) as the liquidity base. You can easily expand it with other global M2 sources or adjust the weights.
Phát hành các Ghi chú
BTC Liquidity-Weighted Business CycleThis indicator models Bitcoin’s macro cycle by comparing its logarithmic price to a log-transformed liquidity proxy, such as US M2 Money Supply (FRED:M2SL). The aim is to highlight cyclical expansions and contractions by tracking how Bitcoin’s price evolves relative to fiat liquidity growth.
Technical Explanation
Log Transformation: Both BTC price and M2 liquidity are expressed in natural logarithms to capture proportional changes rather than raw levels.
Liquidity Ratio: The indicator evaluates Bitcoin’s performance relative to liquidity growth by comparing log(BTC) against log(M2).
MACD Framework: A Moving Average Convergence Divergence model is applied to the ratio to extract cycle momentum, with adjustable lengths.
Visual Outputs:
Histogram bars show expansion (positive momentum) or contraction (negative momentum).
An optional overlay line tracks the long-term BTC-to-liquidity trend.
Peak markers flag potential cycle tops.
User-Friendly Overview
Think of this as a Bitcoin business cycle tracker.
When the histogram is positive, BTC is expanding faster than liquidity (risk-on conditions).
When it’s negative, BTC is underperforming liquidity (risk-off conditions).
Cycle markers give an idea of when long-term tops and bottoms may form.
Use Cases
Spotting macro cycle tops and bottoms in Bitcoin
Timing accumulation or profit-taking windows
Understanding how monetary expansion or contraction affects BTC price action
Notes
The default version uses US M2 (FRED:M2SL) as the liquidity base. Traders may extend the framework to include additional global M2 sources or custom liquidity indices with user-defined weights.
Mã nguồn mở
Theo đúng tinh thần TradingView, tác giả của tập lệnh này đã công bố nó dưới dạng mã nguồn mở, để các nhà giao dịch có thể xem xét và xác minh chức năng. Chúc mừng tác giả! Mặc dù bạn có thể sử dụng miễn phí, hãy nhớ rằng việc công bố lại mã phải tuân theo Nội quy.
Thông báo miễn trừ trách nhiệm
Thông tin và các ấn phẩm này không nhằm mục đích, và không cấu thành, lời khuyên hoặc khuyến nghị về tài chính, đầu tư, giao dịch hay các loại khác do TradingView cung cấp hoặc xác nhận. Đọc thêm tại Điều khoản Sử dụng.