OPEN-SOURCE SCRIPT
200 EMA Trend Strategy Anti mean
Description:
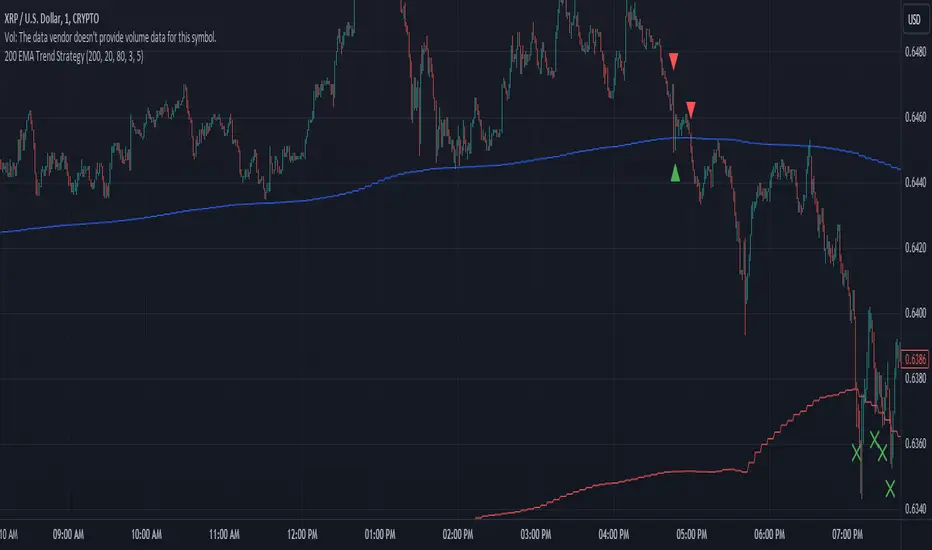
The "200 EMA Trend Strategy" is a versatile technical analysis tool designed for day trading and long-term investing. It aims to identify potential trend reversal points in the market based on the interaction between the price and the 200-period Exponential Moving Average (EMA). This strategy utilizes the 200 EMA, standard deviation bands, and basic trend analysis to generate buy and sell signals.
Key Features:
200-period Exponential Moving Average (EMA): The indicator plots the 200-period Exponential Moving Average, a reliable trend-following indicator that smooths out price data to identify the underlying trend direction.
Standard Deviation Bands: Upper and lower bands around the 200 EMA are calculated based on a specified standard deviation multiplier. These bands help identify potential overbought and oversold levels in the market.
Trend Signals: Buy signals are generated when the price crosses above the 200 EMA, indicating a potential bullish trend, while sell signals are generated when the price crosses below the 200 EMA, indicating a potential bearish trend.
Exit Signals: Exit signals are triggered when the price moves beyond the standard deviation bands in the opposite direction of the current trend. Most trades will be exited with minimal losses, aiming to grow the trading account over time. Multiple exit signals may be displayed, but only the first signal will be considered, ignoring subsequent signals to minimize drawdown.
Usage:
Day Trading: For intraday trading, traders can use a one-minute chart and fix the indicator's timeframe to five minutes. This allows for quick decision-making and minimizes drawdown by focusing on short-term price movements.
Long-Term Investing: For long-term investing, traders can utilize a four-hour or two-hour chart and fix the indicator's timeframe to daily or one-day timeframe. This provides a broader perspective of the market trends and allows for strategic positioning over longer time horizons.
Risk Management: Employ proper risk management techniques and position sizing strategies to mitigate losses and maximize profits. Use the indicator's exit signals to exit trades with minimal losses and allow profitable trades to grow the trading account over time.
Risk Disclosure: Trading involves risks, and this indicator should be used as part of a comprehensive trading strategy. It is essential to consider risk management principles and employ proper position sizing techniques when trading based on the signals generated by this indicator.
Mã nguồn mở
Theo đúng tinh thần TradingView, tác giả của tập lệnh này đã công bố nó dưới dạng mã nguồn mở, để các nhà giao dịch có thể xem xét và xác minh chức năng. Chúc mừng tác giả! Mặc dù bạn có thể sử dụng miễn phí, hãy nhớ rằng việc công bố lại mã phải tuân theo Nội quy.
Thông báo miễn trừ trách nhiệm
Thông tin và các ấn phẩm này không nhằm mục đích, và không cấu thành, lời khuyên hoặc khuyến nghị về tài chính, đầu tư, giao dịch hay các loại khác do TradingView cung cấp hoặc xác nhận. Đọc thêm tại Điều khoản Sử dụng.