OPEN-SOURCE SCRIPT
Indicator: Forecast Oscillator & a BB extrapolation experiment
FOSC (Forecast Oscillator, %F) is implemented as explained by Kaufman (there are lot of representations out there, using linregs, this one is not.).
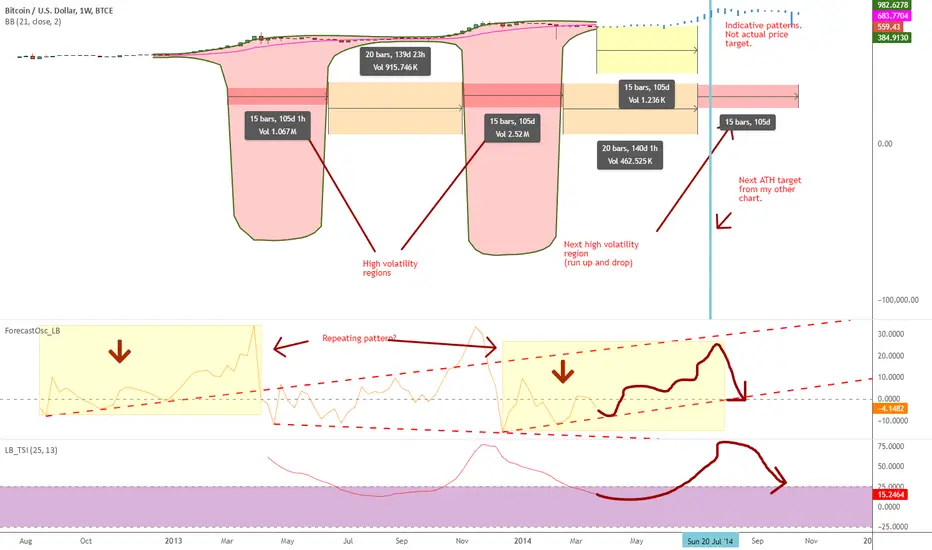
This indicator plots a 3-period smoothing of %F. When %F = 0, the trend line and prices are moving parallel to one another; when %F is above 0 the market is accelerating away from the trend line; when %F is below 0 prices are slowing down and the two series are converging.
Now on to the BB extrapolation: As you can see above, a 21-period BB on 1W shows 2 volatile areas of same length. Simple projection using the same time periods gives us a similar volatile area in another 105d. FOSC is forming a similar pattern now as of the first area. More information in the chart markings.
Interesting thing for me was how my other chart (tradingview.com/v/HeSyTev8/) aligned with this. Lets see how far these timelines are respected.
In the mean time, feel free to "Make mine" this and use FOSC in your charts. Appreciate any feedback / comments.
Mã nguồn mở
Theo đúng tinh thần TradingView, tác giả của tập lệnh này đã công bố nó dưới dạng mã nguồn mở, để các nhà giao dịch có thể xem xét và xác minh chức năng. Chúc mừng tác giả! Mặc dù bạn có thể sử dụng miễn phí, hãy nhớ rằng việc công bố lại mã phải tuân theo Nội quy.
List of my free indicators: bit.ly/1LQaPK8
List of my indicators at Appstore: blog.tradingview.com/?p=970
List of my indicators at Appstore: blog.tradingview.com/?p=970
Thông báo miễn trừ trách nhiệm
Thông tin và các ấn phẩm này không nhằm mục đích, và không cấu thành, lời khuyên hoặc khuyến nghị về tài chính, đầu tư, giao dịch hay các loại khác do TradingView cung cấp hoặc xác nhận. Đọc thêm tại Điều khoản Sử dụng.