INVITE-ONLY SCRIPT
ATR Exhaustion
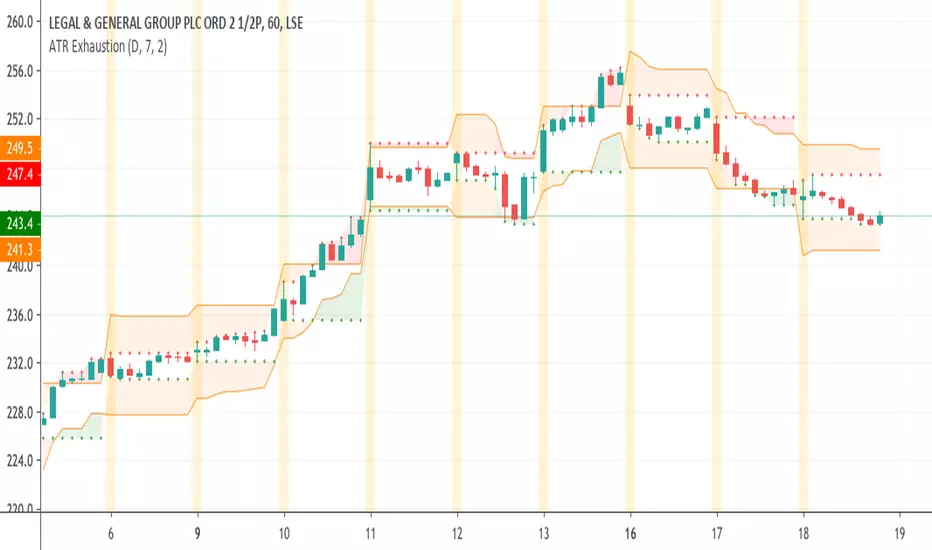
The ATR Exhaustion indicator for Tradingview will overlay the minimum and maximum price limits for a timeframe over your chart. It calculates the price limits be adding and subtracting the ATR level from the high and lows of the period you are interested in.
For example, you can see the daily upper and lower ATR levels whilst on a 15-minute chart. The upper and lower ranges will update as price moves.
Why would this be useful?
It the true price range on average does not move more than x pips/points, then the range boundaries might provide support/resistance levels as price approaches the levels. Additionally, you can use this tool to easily identify how volatile price action has been in comparison to previous periods.
Features
- Easily see ATR Exhaustion areas in any timeframe
- Period highs and lows are plotted and updated as price action unfolds
- Color fills change when price moves beyond the ATR range for easy identification of periods of strong trends or volatility.
Tập lệnh chỉ hiển thị cho người được mời
Quyền truy cập vào tập lệnh này bị hạn chế đối với người dùng được tác giả ủy quyền và thường yêu cầu thanh toán. Bạn có thể thêm nó vào mục yêu thích của mình, nhưng bạn sẽ chỉ có thể sử dụng nó sau khi yêu cầu sự cho phép từ tác giả. Liên hệ BacktestRookies để thêm thông tin, hoặc làm theo hướng dẫn của tác giả bên dưới.
TradingView gợi ý bạn không trả tiền để sử dụng tập lệnh trừ khi bạn tin tưởng 100% vào tác giả của tập lệnh và hiểu cách hoạt động của tập lệnh. Trong nhiều trường hợp, bạn có thể tìm thấy giải pháp thay thế nguồn mở tốt miễn phí trong Tập lệnh cộng đồng của chúng tôi.
Hướng dẫn của tác giả
″
Bạn muốn sử dụng tập lệnh này trên biểu đồ?
Cảnh báo: vui lòng đọc trước khi yêu cầu quyền truy cập.
Thông báo miễn trừ trách nhiệm
Thông tin và ấn phẩm không có nghĩa là và không cấu thành, tài chính, đầu tư, kinh doanh, hoặc các loại lời khuyên hoặc khuyến nghị khác được cung cấp hoặc xác nhận bởi TradingView. Đọc thêm trong Điều khoản sử dụng.