OPEN-SOURCE SCRIPT
Ultra Disparity Index
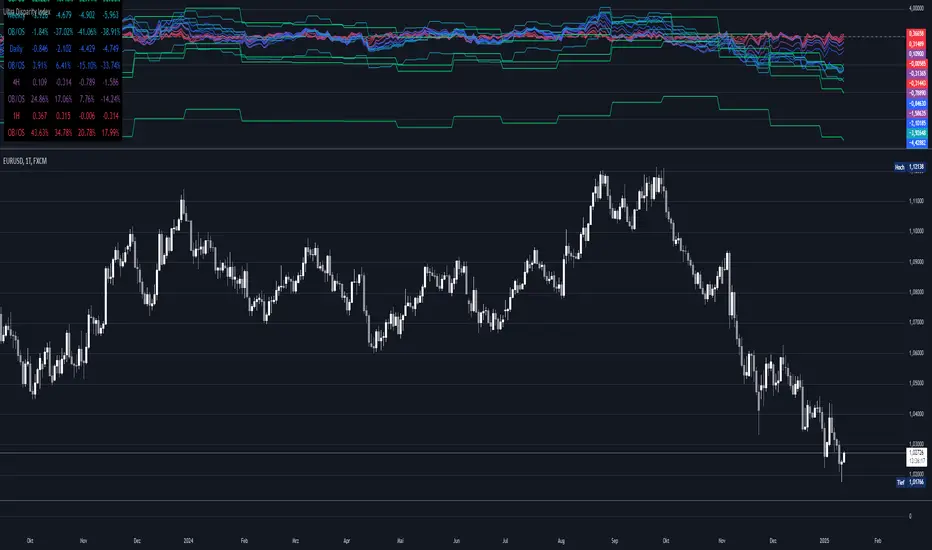
Gain insights into price movements across multiple timeframes with the Ultra Disparity Index. This indicator highlights overbought/oversold levels based on price disparities from moving averages.
Introduction
The Ultra Disparity Index is designed for traders who seek a deeper understanding of price movements and trends across various timeframes. By analyzing the disparity between the current price and its moving averages, the indicator helps identify overbought and oversold conditions.
Detailed Description
The indicator works by calculating the percentage difference between the current price and its moving averages over four user-defined lengths. It operates on multiple timeframes monthly, weekly, daily, 4-hour, and 1-hour giving traders a comprehensive view of market dynamics.
.........
.........
Summary
The indicator uses simple moving averages (SMAs) as a benchmark for calculating disparity. This disparity is then analyzed using statistical tools, such as standard deviation, to derive meaningful levels. Finally, the results are visualized in a table, providing traders with an easy-to-read summary of disparity values and their respective normalized percentages.
Introduction
The Ultra Disparity Index is designed for traders who seek a deeper understanding of price movements and trends across various timeframes. By analyzing the disparity between the current price and its moving averages, the indicator helps identify overbought and oversold conditions.
Detailed Description
The indicator works by calculating the percentage difference between the current price and its moving averages over four user-defined lengths. It operates on multiple timeframes monthly, weekly, daily, 4-hour, and 1-hour giving traders a comprehensive view of market dynamics.
.........
- Disparity Calculation
The indicator computes how far the current price is from moving averages to reveal the degree of disparity.
..... - Overbought/Oversold Zones
By normalizing disparities into percentages relative to the overbought/oversold range, the indicator represents overbought (100%) and oversold (-100%).
..... - Timeframe Flexibility
The user can visualize data from monthly to hourly intervals, ensuring adaptability to different trading strategies.
..... - Customizable Inputs
Users can configure moving average lengths and toggle visibility for specific timeframes and levels.
.........
Summary
The indicator uses simple moving averages (SMAs) as a benchmark for calculating disparity. This disparity is then analyzed using statistical tools, such as standard deviation, to derive meaningful levels. Finally, the results are visualized in a table, providing traders with an easy-to-read summary of disparity values and their respective normalized percentages.
Mã nguồn mở
Theo đúng tinh thần TradingView, tác giả của tập lệnh này đã công bố nó dưới dạng mã nguồn mở, để các nhà giao dịch có thể xem xét và xác minh chức năng. Chúc mừng tác giả! Mặc dù bạn có thể sử dụng miễn phí, hãy nhớ rằng việc công bố lại mã phải tuân theo Nội quy.
Thông báo miễn trừ trách nhiệm
Thông tin và các ấn phẩm này không nhằm mục đích, và không cấu thành, lời khuyên hoặc khuyến nghị về tài chính, đầu tư, giao dịch hay các loại khác do TradingView cung cấp hoặc xác nhận. Đọc thêm tại Điều khoản Sử dụng.