INVITE-ONLY SCRIPT
TWA - Surge
Cập nhật
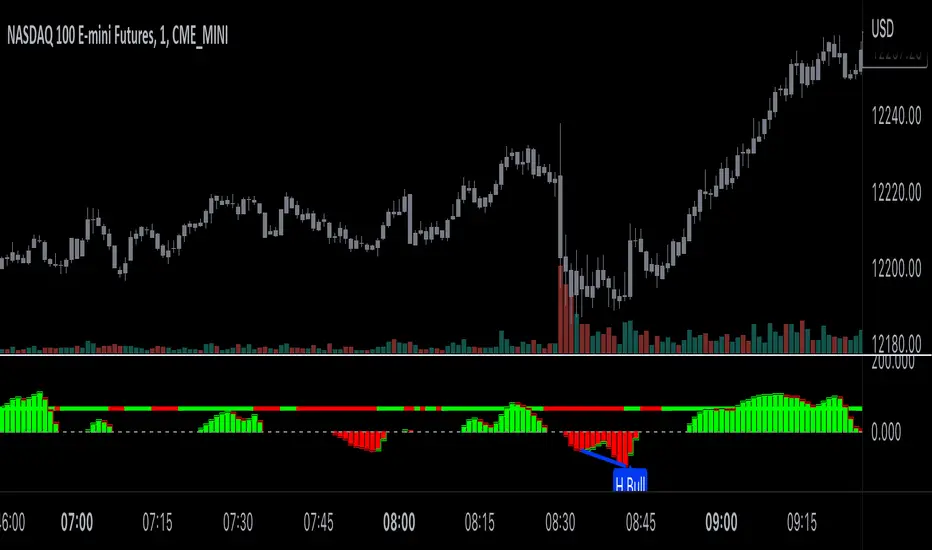
With the TWA Surge indicator we make price and volume impulses easy to read.
Ideally if you are looking to go long look for a red surge and if your looking to go short look for a green surge.
Volume traders out there always wonder if its a bull rush or a falling knife and not sure when that push of volume and momentum will slow down. That's where the borders of the surge come in when a green surge gets a red border forming or a red surge gets a green border forming that means it's show time.
Lastly the surge has exhausted volume built in as well so when you see a different color in your red or green surges you will be able to get further confirmation that the team you are trading against needs to take a break and your team is at full strength ready to take them down.
Under the hood the surge impulses are calculated using a proprietary algorithm involving the amount of standard deviations price deviates from an average, and accumulations of volume for both above and below average volume .
Similarly the exhausted volume looks for strong deviations from the average amount of volume . Standard deviations of price measure the amount of variation or dispersion among price values. Looking at price and volume through the lens of standard deviations it can be seen when price and/or volume are outside of their statistical norm, hence as outliers or extremes they become more likely to reverse and return to a statistical norm.
This increased tendency for a reversal makes the surges on the TWA Surge a useful tool for finding trade opportunities.
The indicator provides many elements to create confluence for trade set-ups. The border of the surge histogram changes color to visually signal when momentum is changing direction. A trade set-up of this would be seeing a red surge form followed by the border turning green. Other elements include horizontal line meters that change colors to show the story of price and momentum.

The uppermost horizontal line meter uses an algorithm to compare price to its recent ranges over multiple times to determine trend direction.
The 2nd horizontal line meter measures the directional efficiency of the movement of price to determine direction in the market.
The 3rd horizontal line meter calculates buying and selling pressure by separating volume that moves price up from volume that moves price down, and comparing that to the total volume .
The 4th horizontal line meter uses an algorithm combining the volatility of recent candles with the statistical likeliness of price to return to its mean in order to determine direction, and if that direction is strengthening or weakening.
Ideally if you are looking to go long look for a red surge and if your looking to go short look for a green surge.
Volume traders out there always wonder if its a bull rush or a falling knife and not sure when that push of volume and momentum will slow down. That's where the borders of the surge come in when a green surge gets a red border forming or a red surge gets a green border forming that means it's show time.
Lastly the surge has exhausted volume built in as well so when you see a different color in your red or green surges you will be able to get further confirmation that the team you are trading against needs to take a break and your team is at full strength ready to take them down.
Under the hood the surge impulses are calculated using a proprietary algorithm involving the amount of standard deviations price deviates from an average, and accumulations of volume for both above and below average volume .
Similarly the exhausted volume looks for strong deviations from the average amount of volume . Standard deviations of price measure the amount of variation or dispersion among price values. Looking at price and volume through the lens of standard deviations it can be seen when price and/or volume are outside of their statistical norm, hence as outliers or extremes they become more likely to reverse and return to a statistical norm.
This increased tendency for a reversal makes the surges on the TWA Surge a useful tool for finding trade opportunities.
The indicator provides many elements to create confluence for trade set-ups. The border of the surge histogram changes color to visually signal when momentum is changing direction. A trade set-up of this would be seeing a red surge form followed by the border turning green. Other elements include horizontal line meters that change colors to show the story of price and momentum.
The uppermost horizontal line meter uses an algorithm to compare price to its recent ranges over multiple times to determine trend direction.
The 2nd horizontal line meter measures the directional efficiency of the movement of price to determine direction in the market.
The 3rd horizontal line meter calculates buying and selling pressure by separating volume that moves price up from volume that moves price down, and comparing that to the total volume .
The 4th horizontal line meter uses an algorithm combining the volatility of recent candles with the statistical likeliness of price to return to its mean in order to determine direction, and if that direction is strengthening or weakening.
Phát hành các Ghi chú
- updated made to the styling tabs to allow more versatile/color customizations
Phát hành các Ghi chú
- updated the styling options of the exhausted volume
Phát hành các Ghi chú
- Added preset alerts
Phát hành các Ghi chú
- Improvement!! Style settings are now available for everything under the styles tab
Phát hành các Ghi chú
- added the option to put strength bar coloring directly on the candles and evidence line coloring on the top bar.
Phát hành các Ghi chú
- added inputs that allows the user to change the colors of all the informational tools the indicator offers to create a customized experience.
Tập lệnh chỉ hiển thị cho người được mời
Quyền truy cập vào tập lệnh này bị hạn chế đối với người dùng được tác giả ủy quyền và thường yêu cầu thanh toán. Bạn có thể thêm nó vào mục yêu thích của mình, nhưng bạn sẽ chỉ có thể sử dụng nó sau khi yêu cầu sự cho phép từ tác giả. Liên hệ TradingwithAdamT_W_A để thêm thông tin, hoặc làm theo hướng dẫn của tác giả bên dưới.
TradingView gợi ý bạn không trả tiền để sử dụng tập lệnh trừ khi bạn tin tưởng 100% vào tác giả của tập lệnh và hiểu cách hoạt động của tập lệnh. Trong nhiều trường hợp, bạn có thể tìm thấy giải pháp thay thế nguồn mở tốt miễn phí trong Tập lệnh cộng đồng của chúng tôi.
Hướng dẫn của tác giả
″Visit tradingwithadam.com for access.
Bạn muốn sử dụng tập lệnh này trên biểu đồ?
Cảnh báo: vui lòng đọc trước khi yêu cầu quyền truy cập.
Thông báo miễn trừ trách nhiệm
Thông tin và ấn phẩm không có nghĩa là và không cấu thành, tài chính, đầu tư, kinh doanh, hoặc các loại lời khuyên hoặc khuyến nghị khác được cung cấp hoặc xác nhận bởi TradingView. Đọc thêm trong Điều khoản sử dụng.