OPEN-SOURCE SCRIPT
Cập nhật Center of Candle Trendline

### **Center of Candle Trendline**
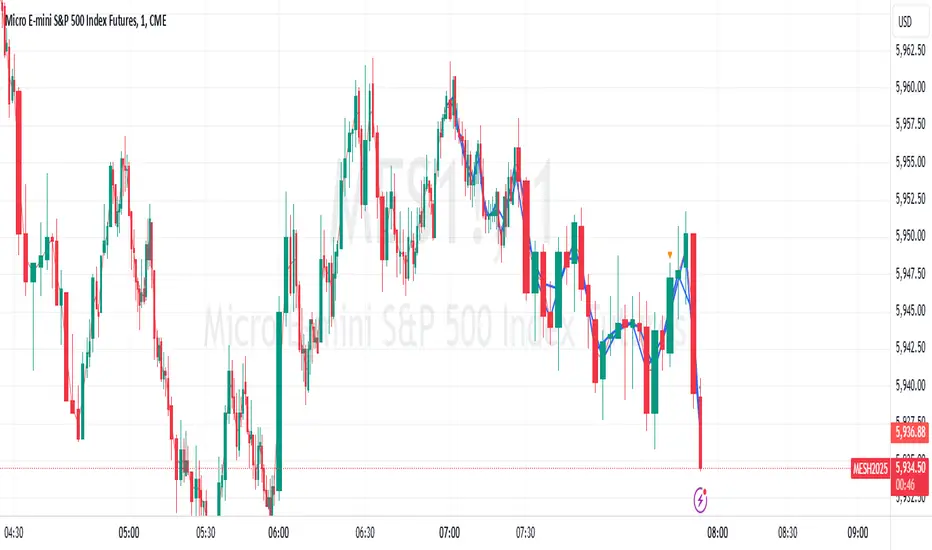
This script dynamically plots a trendline through the center of each candlestick's body. The "center" is calculated as the average of the open and close prices for each candle. The trendline updates in real-time as new candles form, providing a clean and straightforward way to track the market's midline movement.
#### **Features:**
1. **Dynamic Trendline:** The trendline connects the center points of consecutive candlestick bodies, giving a clear visual representation of price movements.
2. **Accurate Center Calculation:** The center is determined as `(open + close) / 2`, ensuring the trendline reflects the true midpoint of each candlestick body.
3. **Real-Time Updates:** The trendline updates automatically as new bars form, keeping your chart up to date with the latest price action.
4. **Customization-Ready:** Adjust the line’s color, width, or style easily to fit your chart preferences.
#### **How to Use:**
- Add this script to your chart to monitor the price movement relative to the center of candlestick bodies.
- Use the trendline to identify trends, reversals, or price consolidation zones.
#### **Applications:**
- **Trend Analysis:** Visualize how the market trends around the center of candlesticks.
- **Reversal Identification:** Detect potential reversal zones when the price deviates significantly from the trendline.
- **Support and Resistance Zones:** Use the trendline as a dynamic support or resistance reference.
This tool is perfect for traders who want a clean and minimalistic approach to tracking price action. Whether you're a beginner or an experienced trader, this script provides valuable insights without overwhelming your chart.
#### **Note:**
This is not a standalone trading strategy but a visual aid to complement your analysis. Always combine it with other tools and techniques for better trading decisions.
---
Feel free to tweak this description based on your preferences or style!
Phát hành các Ghi chú
removed extra blue lineMã nguồn mở
Theo đúng tinh thần TradingView, tác giả của tập lệnh này đã công bố nó dưới dạng mã nguồn mở, để các nhà giao dịch có thể xem xét và xác minh chức năng. Chúc mừng tác giả! Mặc dù bạn có thể sử dụng miễn phí, hãy nhớ rằng việc công bố lại mã phải tuân theo Nội quy.
Thông báo miễn trừ trách nhiệm
Thông tin và các ấn phẩm này không nhằm mục đích, và không cấu thành, lời khuyên hoặc khuyến nghị về tài chính, đầu tư, giao dịch hay các loại khác do TradingView cung cấp hoặc xác nhận. Đọc thêm tại Điều khoản Sử dụng.
Mã nguồn mở
Theo đúng tinh thần TradingView, tác giả của tập lệnh này đã công bố nó dưới dạng mã nguồn mở, để các nhà giao dịch có thể xem xét và xác minh chức năng. Chúc mừng tác giả! Mặc dù bạn có thể sử dụng miễn phí, hãy nhớ rằng việc công bố lại mã phải tuân theo Nội quy.
Thông báo miễn trừ trách nhiệm
Thông tin và các ấn phẩm này không nhằm mục đích, và không cấu thành, lời khuyên hoặc khuyến nghị về tài chính, đầu tư, giao dịch hay các loại khác do TradingView cung cấp hoặc xác nhận. Đọc thêm tại Điều khoản Sử dụng.