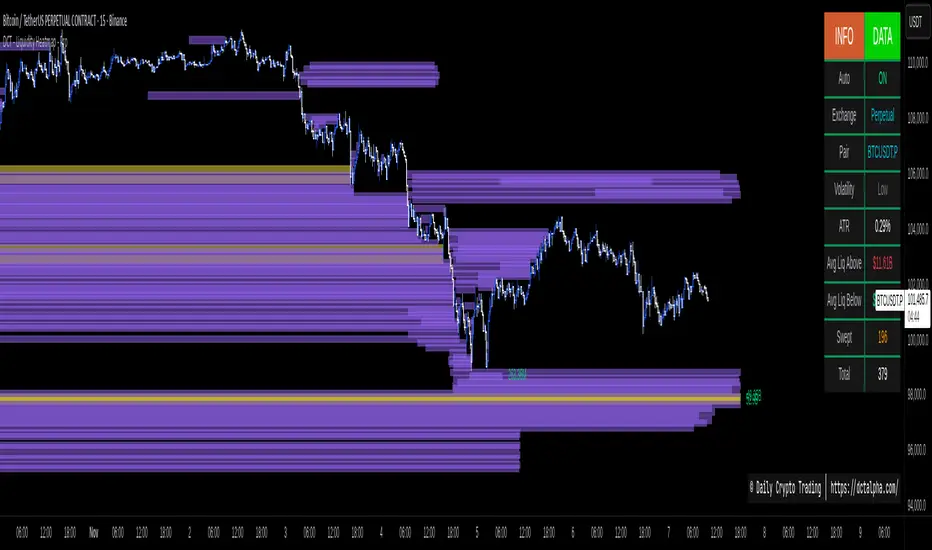
DCT - Liquidity Heatmap - Pro
--------
The DCT Liquidity Heatmap Pro is an advanced order flow visualization tool designed specifically for cryptocurrency markets operating 24/7. This indicator identifies and tracks liquidity accumulation zones where significant buy and sell orders cluster, helping traders understand potential support/resistance areas and market microstructure.
WHAT IT DOES
------------
This script creates a visual heatmap of liquidity levels by analyzing volume intensity and price action across multiple timeframes. It automatically detects and displays:
- BID LEVELS (below price): Areas where buy-side liquidity accumulates
- ASK LEVELS (above price): Areas where sell-side liquidity accumulates
- SWEPT ZONES: Levels that have been taken out by price action
- VOLUME INTENSITY: Color-coded gradient showing relative strength of each level
The indicator uses a pure gradient system:
- Purple (Low): 0-25% volume intensity
- Yellow (Mid): 25-50% volume intensity
- Orange (High): 50-75% volume intensity
- Red (Extreme): 75%+ volume intensity
When CVD (Cumulative Volume Delta) is enabled, colors adapt to show directional bias:
- Green tint: Buy pressure dominant (>60%)
- Red tint: Sell pressure dominant (<40%)
KEY FEATURES
------------
1. AUTO-DETECTION: Automatically identifies market type (BTC/ETH, Major Altcoins, Low Cap/Volatile) and exchange type (Perpetual/Spot) based on the ticker symbol
2. DYNAMIC ADJUSTMENTS: Automatically adapts spacing, level count, and retention based on:
- Current timeframe (5m to Daily+)
- ATR-based volatility (Low, Normal, High, Extreme)
- Market type characteristics
3. CVD TRACKING: Optional Cumulative Volume Delta calculation showing net buy/sell pressure over time, with real-time dollar values displayed in the info table
4. SWEPT LEVEL PRESERVATION: Maintains swept levels on the chart with original color coding for historical reference and pattern analysis
5. FORWARD PROJECTION: Extends active (non-swept) levels into the future to show where liquidity currently exists
6. SMART CLEANUP: Automatic memory management removes old swept levels based on configurable retention period (default: 2000 bars)
7. IMBALANCE DETECTION: Visual markers (triangles) indicating significant buy/sell imbalances at current price
8. REAL-TIME ALERTS: Configurable alerts for:
- Level sweeps (when price takes out a liquidity level)
- Price approaching significant levels
9. COMPREHENSIVE INFO TABLE: Live statistics showing:
- Auto-detection status
- Market and exchange type
- Current volatility state (with ATR percentage)
- CVD values and directional bias
- Dollar liquidity estimates above/below price
- Count of swept and total levels
ORIGINALITY & VALUE PROPOSITION
--------------------------------
This script is completely original code developed from the ground up for cryptocurrency trading. Unlike generic liquidity indicators designed for traditional markets, this tool addresses specific challenges in crypto:
CRYPTO-SPECIFIC OPTIMIZATIONS:
- 24/7 market operation (session-based analysis removed as irrelevant for crypto)
- Higher volatility handling with ATR-based dynamic adjustments
- Perpetual vs Spot differentiation
- Market-cap based calibration (BTC/ETH, Major Alts, Low Cap)
TECHNICAL INNOVATIONS:
- Pure gradient intensity system eliminating redundant major/minor classifications
- Volume accumulation algorithm that builds strength over time
- Smart memory management preventing performance degradation on long charts
- Swept level preservation with color retention for pattern recognition
WHY CLOSED-SOURCE:
The proprietary algorithms for volume intensity calculation, dynamic parameter adjustment, and liquidity level clustering represent significant research and development. The specific mathematical models and calibration for crypto markets provide a competitive edge that warrants code protection.
WHAT THIS SCRIPT IS NOT
------------------------
IMPORTANT LIMITATIONS TO UNDERSTAND:
1. NOT PREDICTIVE: This indicator shows where liquidity EXISTS, not where price WILL go. Liquidity levels can be swept without reversals, or price may never reach certain levels. No future performance is implied or guaranteed.
2. NOT A COMPLETE SYSTEM: This is a visualization tool for understanding order flow and market microstructure. It should be used alongside proper risk management, fundamental analysis, and other technical tools. It does not generate entry/exit signals.
3. TIMEFRAME DEPENDENT: Effectiveness varies by timeframe. Lower timeframes (5m-15m) show more granular but potentially noisier data. Higher timeframes (4H-Daily) show broader structure but with less precision for intraday trading.
4. VOLUME LIMITATIONS: Crypto exchange volume data can vary significantly between exchanges and may include wash trading or other manipulated volume. The indicator works with whatever volume data your exchange provides.
5. BACKTESTING CONSTRAINTS: While swept levels are preserved historically, the indicator calculates levels in real-time. Historical visualization shows where levels WERE, not how they would have appeared to a trader in real-time at that moment.
6. NOT FOR ALL MARKETS: Optimized specifically for cryptocurrency perpetual and spot markets. May not perform optimally on traditional stocks, forex, or futures without parameter adjustment.
HOW TO USE
----------
1. Add the indicator to your chart
2. Verify auto-detection has correctly identified your market (check info table)
3. Adjust "Spacing" slider if you want wider/tighter level clustering
4. Enable CVD if you want directional volume bias analysis
5. Configure alerts for sweeps or level approaches if desired
6. Use "Compact" mode on smaller screens to reduce table size
RECOMMENDED SETTINGS BY TIMEFRAME:
- Scalping (5m-15m): Default settings, focus on immediate levels
- Swing Trading (1H-4H): Enable "Extend All" for broader view
- Position Trading (Daily+): Increase spacing 20-30% for major levels only
PERFORMANCE NOTES
-----------------
The script is optimized for performance but users should be aware:
- Maximum 500 boxes can be displayed (TradingView limitation)
- Retention set to 2000 bars by default (configurable 10-5000)
- On very long charts (>5000 bars), older swept levels will be deleted
- Lower timeframes generate more levels and may hit box limits faster
ALERT CONDITIONS
----------------
Two alert types available:
1. SWEEP ALERTS: Triggered when price takes out a liquidity level
2. PROXIMITY ALERTS: (Disabled by default) Warns when price approaches significant levels
Configure alert distance threshold in settings (default: 0.5% of price)
SUPPORT & USAGE
---------------
This is an advanced tool requiring understanding of:
- Order flow concepts and liquidity sweeps
- Volume profile interpretation
- Crypto market microstructure
- Risk management principles
Successful use requires combining this tool with your existing trading methodology and proper risk controls. Past swept levels and current liquidity zones do not guarantee future price behavior.
TECHNICAL SPECIFICATIONS
-------------------------
- Pine Script v6
- Overlay: true
- Max boxes: 500
- Max labels: 50 (though labels removed in Pro edition)
- Memory optimized with smart cleanup routines
- Compatible with Perpetual and Spot crypto markets
NO WARRANTIES
-------------
As with all technical indicators, this tool is provided for informational and educational purposes. No representations are made regarding future performance or profitability. Trading cryptocurrencies involves substantial risk of loss. Always conduct your own research and never risk more than you can afford to lose.
The indicator displays levels based on historical and current volume data, which does not constitute investment advice or a recommendation to buy or sell. Market conditions change, and what worked in the past may not work in the future.
### Enhanced Accuracy:
- Improved liquidity calculations for better precision across all trading pairs
- Optimized volume tracking for more reliable zone detection
- Enhanced price level accuracy for low-price and high-volatility pairs
### Visual Enhancements:
- Improved label visibility and readability
- Better formatting for dollar amounts (supports billions to single dollars)
- Enhanced swept zone identification with improved visual indicators
- Added configurable label sizing options
### User Experience:
- Added pair name display in information table
- New toggle control for liquidity labels
- Improved chart clarity and information display
- Better performance on various timeframes
This update focuses on calculation accuracy and visual improvements to help traders make better informed decisions.
### Critical Fix:
- Fixed liquidity table calculation to show average per level instead of total accumulation
- Resolved unrealistic billion-dollar values on high-price pairs (BTC, ETH)
- Table now displays "Avg Liq Above/Below" for accurate per-level measurements
### Additional Improvements:
- Added comprehensive tooltips to all settings for better user guidance
- Enhanced documentation for each parameter
- Improved user onboarding experience
This update addresses a critical calculation issue that affected the accuracy of liquidity measurements in the information table. The indicator now provides realistic per-level averages instead of accumulated totals, making the data more actionable for trading decisions.
### Setting Change:
- Adjusted default setting for improved out-of-box user experience
- Changed liquidity labels to display by default (previously required manual activation)
This minor update ensures users see liquidity values immediately upon adding the indicator to their chart, reducing configuration steps and improving initial usability.
### Critical Bug Fix:
- Fixed runtime error "Row 10 is out of table bounds" that occurred with specific settings
- Resolved crash when using CVD on Spot markets with full table display
- Table properly sized to accommodate all display fields
### Settings Improvement:
- Changed "Extend All" default to enabled for better visual continuity
- Levels now extend to current bar by default, improving chart readability
- Users can still disable this in Performance settings if preferred
This update addresses a critical table sizing issue that could crash the indicator under specific configurations, and improves the default user experience with better level visualization.
### What's New:
Two new display toggles provide precise control over label visibility:
1. **High Intensity Filter** - Display labels only on zones with ≥25% intensity (yellow/orange/red). Low intensity zones remain visible as boxes. Default: ON
2. **Swept Labels Toggle** - Control visibility of swept zone indicators. Default: OFF
### Usage:
Find both options in Display settings. Enable/disable based on your chart analysis needs.
**Default configuration** shows only high-intensity active liquidity labels for reduced clutter while maintaining full zone visualization.
Both settings work independently and can be adjusted anytime without affecting calculations.
---
This update addresses requests for customizable label density on charts with high liquidity zone counts.
### New Display Features:
- High Intensity Filter (Default: ON)
- Swept Labels Control (Default: OFF)
### Visual Enhancements:
- Improved label formatting
- Enhanced tooltips
- Optimized defaults
### Default Configuration Changes:
- Clean view by default
- Both toggles independent
+ Benefits og usage sektion
### New Display Features:
Added two toggles in Display settings for label control:
1. **High Intensity Only** - Show labels only on yellow/orange/red zones (≥25% intensity). Default: ON
2. **Show Swept Labels** - Control swept zone indicator visibility. Default: OFF
### Default Changes:
Updated default settings for cleaner chart visualization out of the box. Both toggles can be adjusted independently in Display settings.
---
This minor update improves visual clarity on charts with high liquidity zone counts.
Changed som settings from off to on by default
improves visual clarity on charts
Tập lệnh chỉ hiển thị cho người được mời
Chỉ những người dùng được tác giả đồng ý mới có thể truy cập tập lệnh này. Bạn cần yêu cầu và xin phép sử dụng tập lệnh này. Quyền truy cập thường được cấp sau khi thanh toán. Để biết thêm chi tiết, hãy làm theo hướng dẫn của tác giả bên dưới hoặc liên hệ trực tiếp với Daily-Crypto-Trading.
TradingView KHÔNG khuyến khích trả tiền hoặc sử dụng tập lệnh trừ khi bạn hoàn toàn tin tưởng tác giả và hiểu cách hoạt động của tập lệnh. Bạn cũng có thể tìm thấy các giải pháp thay thế miễn phí, mã nguồn mở trong mục tập lệnh cộng đồng của chúng tôi.
Hướng dẫn của tác giả
Thông báo miễn trừ trách nhiệm
Tập lệnh chỉ hiển thị cho người được mời
Chỉ những người dùng được tác giả đồng ý mới có thể truy cập tập lệnh này. Bạn cần yêu cầu và xin phép sử dụng tập lệnh này. Quyền truy cập thường được cấp sau khi thanh toán. Để biết thêm chi tiết, hãy làm theo hướng dẫn của tác giả bên dưới hoặc liên hệ trực tiếp với Daily-Crypto-Trading.
TradingView KHÔNG khuyến khích trả tiền hoặc sử dụng tập lệnh trừ khi bạn hoàn toàn tin tưởng tác giả và hiểu cách hoạt động của tập lệnh. Bạn cũng có thể tìm thấy các giải pháp thay thế miễn phí, mã nguồn mở trong mục tập lệnh cộng đồng của chúng tôi.