OPEN-SOURCE SCRIPT
Triple RSI Multi-Timeframe
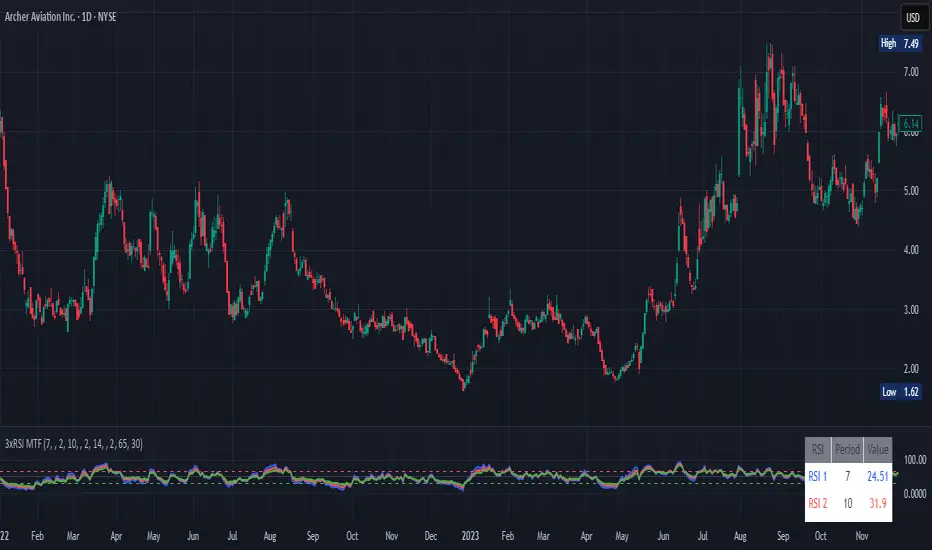
This indicator shows three RSI lines together so you can read market momentum on multiple timeframes at once. Each RSI has its own period, timeframe, and color, so you can quickly tell which line is fast, medium, or slow.
What it helps with
Spot overbought and oversold zones using the 70 and 30 levels, plus an optional midline at 50 for trend bias.
Align signals across timeframes: when two or three RSIs agree, the move is usually stronger.
Time entries and exits: use the shorter‑timeframe RSI for precise timing and the higher‑timeframe RSI for direction.
How to use
Choose the period and timeframe for RSI 1, 2, and 3 based on your style (e.g., 14 on current TF, 21 on 5m, 50 on 15m).
Pick distinct colors so you can recognize each line easily.
Turn on alerts to get notified when any RSI crosses into overbought or oversold.
Mã nguồn mở
Theo đúng tinh thần TradingView, người tạo ra tập lệnh này đã biến tập lệnh thành mã nguồn mở để các nhà giao dịch có thể xem xét và xác minh công năng. Xin dành lời khen tặng cho tác giả! Mặc dù bạn có thể sử dụng miễn phí, nhưng lưu ý nếu đăng lại mã, bạn phải tuân theo Quy tắc nội bộ của chúng tôi.
Thông báo miễn trừ trách nhiệm
Thông tin và ấn phẩm không có nghĩa là và không cấu thành, tài chính, đầu tư, kinh doanh, hoặc các loại lời khuyên hoặc khuyến nghị khác được cung cấp hoặc xác nhận bởi TradingView. Đọc thêm trong Điều khoản sử dụng.