OPEN-SOURCE SCRIPT
Break Point Record Table — GSK-VIZAG-AP-INDIA
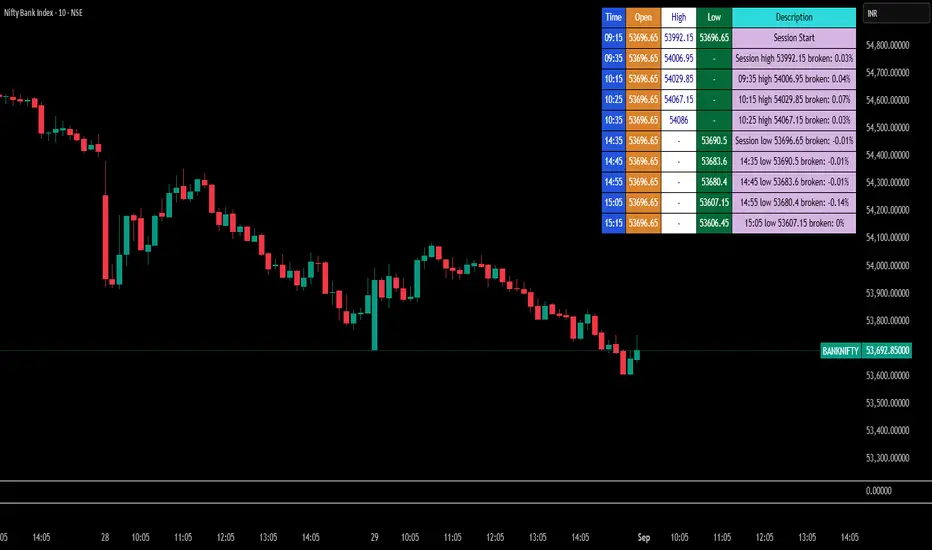
"Break Point Record Table — GSK-VIZAG-AP-INDIA" indicator captures key break points during each trading session and presents a clear, color-coded table overlay on the chart for quick visual reference. Specifically, it logs sessions' open price and monitors subsequent price action for notable breaks in the session high or low prices. Each break event is recorded with the time, price, and percentage change from the previous break, helping traders identify significant price movements within the session at a glance.
Key Features:
Records the session start time and opening price for context.
Tracks every intraday break above the previous session high or below the previous session low.
Calculates and displays the percentage change at each break event.
Highlights breaks with descriptive text including break time and values to aid trade decision-making.
Displays a table with columns for Time, Open, High, Low, and a Description of the event.
Uses color-coded cells to differentiate between session start, highs, lows, and break descriptions for better readability.
Maintains performance and readability by limiting the table to the latest 30 break events.
Usage & Benefits:
This indicator is ideal for intraday traders who want reliable visual cues to monitor momentum shifts and breakout/breakdown points during the trading day. By capturing these break points as discrete events and organizing the data into an easily accessible, visually intuitive table, it improves situational awareness and supports timely trading decisions.
Mã nguồn mở
Theo đúng tinh thần TradingView, tác giả của tập lệnh này đã công bố nó dưới dạng mã nguồn mở, để các nhà giao dịch có thể xem xét và xác minh chức năng. Chúc mừng tác giả! Mặc dù bạn có thể sử dụng miễn phí, hãy nhớ rằng việc công bố lại mã phải tuân theo Nội quy.
"Created by GSK-VIZAG-AP-INDIA"
Thông báo miễn trừ trách nhiệm
Thông tin và các ấn phẩm này không nhằm mục đích, và không cấu thành, lời khuyên hoặc khuyến nghị về tài chính, đầu tư, giao dịch hay các loại khác do TradingView cung cấp hoặc xác nhận. Đọc thêm tại Điều khoản Sử dụng.