RSI5 Multi Time Frame Indicator
Date of Creation: 12/13/2016
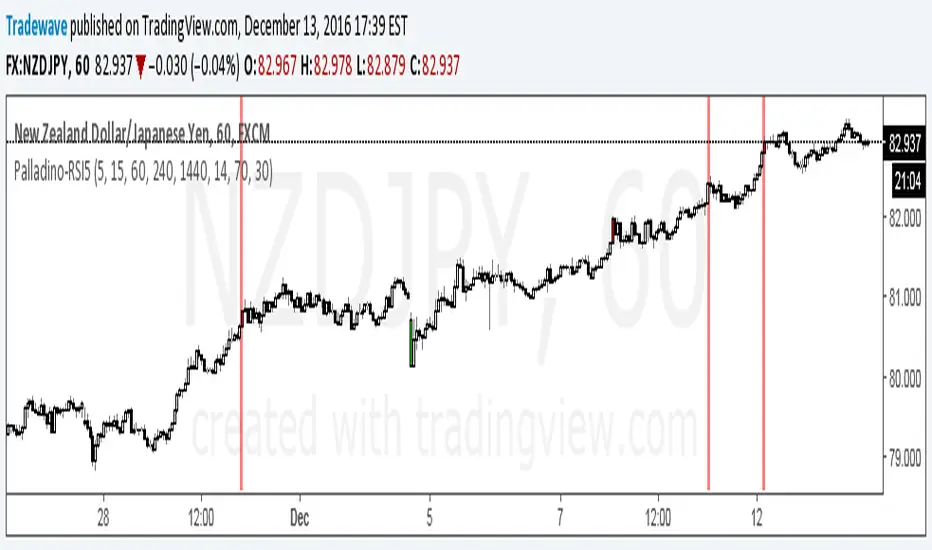
Checks overbought or oversold conditions across 5 time frames.
If Time frame 1, 2 and 3 are all overbought then bar color changes to red
If Time frame 1, 2 and 3 are all oversold then bar color changes to green
If Time frame 1, 2, 3, 4 and 5 are all overbought then a vertical red line is added to the plot
If Time frame 1, 2, 3, 4 and 5 are all oversold then a vertical green line is added to the plot
The user has the ability to change:
1) Any of the 5 time frames (Set in minutes: m5 = 5, m15 = 15, h1 = 60, h4 = 240, D = 1440...)
2) RSI overbought threshold Level
3) RSI oversold threshold Level
4) RSI Period
Tập lệnh chỉ hiển thị cho người được mời
Chỉ những người dùng được tác giả chấp thuận mới có thể truy cập tập lệnh này. Bạn sẽ cần yêu cầu và được cấp quyền sử dụng. Thông thường quyền này được cấp sau khi thanh toán. Để biết thêm chi tiết, làm theo hướng dẫn của tác giả bên dưới hoặc liên hệ trực tiếp với LiquidityTracker.
TradingView KHÔNG khuyến nghị bạn trả phí hoặc sử dụng một tập lệnh trừ khi bạn hoàn toàn tin tưởng vào tác giả và hiểu cách hoạt động của tập lệnh. Bạn cũng có thể tìm các lựa chọn miễn phí, mã nguồn mở trong các script cộng đồng của chúng tôi.
Hướng dẫn của tác giả
Thông báo miễn trừ trách nhiệm
Tập lệnh chỉ hiển thị cho người được mời
Chỉ những người dùng được tác giả chấp thuận mới có thể truy cập tập lệnh này. Bạn sẽ cần yêu cầu và được cấp quyền sử dụng. Thông thường quyền này được cấp sau khi thanh toán. Để biết thêm chi tiết, làm theo hướng dẫn của tác giả bên dưới hoặc liên hệ trực tiếp với LiquidityTracker.
TradingView KHÔNG khuyến nghị bạn trả phí hoặc sử dụng một tập lệnh trừ khi bạn hoàn toàn tin tưởng vào tác giả và hiểu cách hoạt động của tập lệnh. Bạn cũng có thể tìm các lựa chọn miễn phí, mã nguồn mở trong các script cộng đồng của chúng tôi.