OPEN-SOURCE SCRIPT
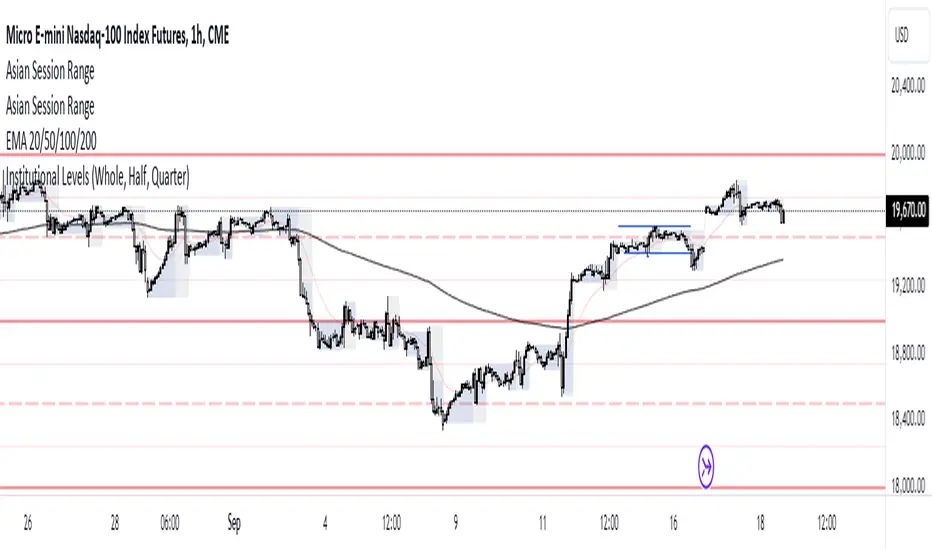
Institutional Levels (Whole, Half, Quarter) By Capitalwithcaleb

This Pine Script indicator is designed to plot institutional levels, which are key price levels that traders often monitor. These levels include whole numbers (like 12000, 12500), half levels (like 12250), and quarter levels (like 12375). The script allows full customization of colors, line styles, and line widths for each type of level (whole, half, and quarter).
Key Features:
Range of Levels:
The user defines a minimum (minLevel) and maximum (maxLevel) price level, and the script plots levels in increments of 50 points (step size of 50 covers quarter, half, and whole levels).
Customizable Appearance:
Color Customization: You can choose separate colors for whole, half, and quarter levels.
Line Style Customization: You can choose between solid, dashed, or dotted lines for each level type (whole, half, and quarter).
Line Width Customization: You can adjust the width of the lines (1 to 5).
Automatic Level Detection:
The script automatically determines whether a level is a whole, half, or quarter level based on whether it is a multiple of 1000 (whole), 500 (half), or 250 (quarter).
Plotting of Lines:
It draws horizontal lines across the entire chart (extend.both) at the calculated levels.
For each level, it determines its type (whole, half, quarter) and plots it using the user-specified colors, line styles, and widths.
Functions:
getLineStyle(styleStr): A functional helper that converts the string input from the user ("Solid", "Dashed", "Dotted") into Pine Script's corresponding line style constants.
plotLevel(level, color, width, style): Another functional helper that plots a line at the given price level with the provided color, width, and line style.
Execution Flow:
User Input: The user specifies the minimum and maximum levels to display on the chart. They also configure the appearance of the lines (color, style, width).
Level Calculation: The script iterates over all levels between the minLevel and maxLevel with a step size of 50, checking if the level is a whole, half, or quarter level.
Line Plotting: The appropriate lines are drawn on the chart, based on the type of level and user settings.
Example Use Case:
If a user sets the minLevel to 12000 and maxLevel to 13000, the script will automatically plot lines at key institutional levels like:
12000 (whole), 12250 (quarter), 12500 (whole), 12750 (quarter), etc.
Mã nguồn mở
Theo đúng tinh thần TradingView, tác giả của tập lệnh này đã công bố nó dưới dạng mã nguồn mở, để các nhà giao dịch có thể xem xét và xác minh chức năng. Chúc mừng tác giả! Mặc dù bạn có thể sử dụng miễn phí, hãy nhớ rằng việc công bố lại mã phải tuân theo Nội quy.
Thông báo miễn trừ trách nhiệm
Thông tin và các ấn phẩm này không nhằm mục đích, và không cấu thành, lời khuyên hoặc khuyến nghị về tài chính, đầu tư, giao dịch hay các loại khác do TradingView cung cấp hoặc xác nhận. Đọc thêm tại Điều khoản Sử dụng.