OPEN-SOURCE SCRIPT
Smooth RSI [MarktQuant]
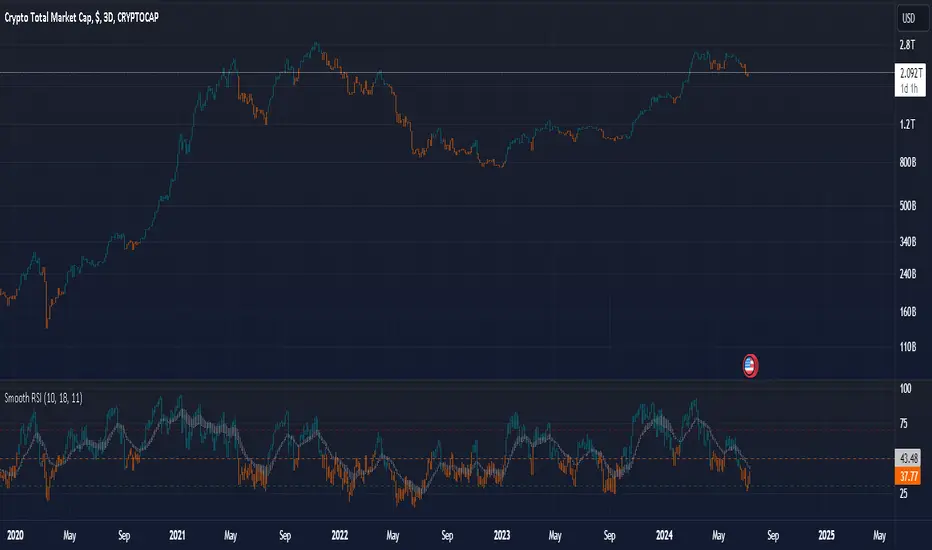
This Smooth RSI offers a nuanced analysis of the Relative Strength Index (RSI) by smoothing it through multiple averaging techniques. It provides additional insights into market movements and potential trading signals.
Key Features:
1. RSI Calculation:
- Calculates the RSI for high, open, low, and close prices over a user-defined period.
- Averages these four RSI values to derive a smoothed RSI.
2. Exponential Moving Average (EMA) of RSI:
- Applies an EMA to each of the four RSI values over a user-defined period.
- Averages these EMA values to produce a smoothed EMA of RSI.
3. Rate of Change (RoC) Calculation:
- Computes the Rate of Change for high, open, low, and close prices over a user-defined period (`lengthc`).
- Averages these four RoC values to generate a smoothed RoC (`sumc`).
- Colors the RoC bars based on their value: positive (green) or negative (red).
4. Trend Indication:
- Identifies long signals when the smoothed RSI is above 50.
- Identifies short signals when the smoothed RSI is below 50.
- Highlights bullish conditions when both long signals and positive RoC are present.
- Highlights bearish conditions when both short signals and negative RoC are present.
5. Visual Elements:
- Bar colors change to teal for bullish conditions and orange for bearish conditions.
- Horizontal lines at 30, 50, and 70 mark key RSI levels.
- Candlestick plots of the smoothed RSI, EMA of RSI, and RoC.
6. Customization Options:
- Toggle visibility of RSI, EMA of RSI, and RoC candlestick plots through input settings in the "Plot Settings" group.
Usage:
- This indicator can be used to smooth out the traditional RSI signals, providing a clearer view of the market's momentum.
- The EMA and RoC components add additional layers of analysis, helping traders confirm trends and potential reversals.
- The color-coded bars and plot lines visually highlight critical levels and conditions, making it easier to interpret the market's behavior at a glance.
This "Smooth RSI" indicator is an advanced tool designed to enhance your technical analysis, offering a refined approach to understanding price momentum and trend strength.
Mã nguồn mở
Theo đúng tinh thần TradingView, tác giả của tập lệnh này đã công bố nó dưới dạng mã nguồn mở, để các nhà giao dịch có thể xem xét và xác minh chức năng. Chúc mừng tác giả! Mặc dù bạn có thể sử dụng miễn phí, hãy nhớ rằng việc công bố lại mã phải tuân theo Nội quy.
🔍 Access Investing Strategies & Indicators
📊 whop.com/marktquant
🌐 marktquant.com
Nothing shared on this page constitutes financial advice. All information, tools, and analyses are provided solely for informational and educational purposes.
📊 whop.com/marktquant
🌐 marktquant.com
Nothing shared on this page constitutes financial advice. All information, tools, and analyses are provided solely for informational and educational purposes.
Thông báo miễn trừ trách nhiệm
Thông tin và các ấn phẩm này không nhằm mục đích, và không cấu thành, lời khuyên hoặc khuyến nghị về tài chính, đầu tư, giao dịch hay các loại khác do TradingView cung cấp hoặc xác nhận. Đọc thêm tại Điều khoản Sử dụng.