OPEN-SOURCE SCRIPT
Moving Average Cross trade PL
Abstract
This script evaluates the potential trading proceeding and loss of the moving average cross strategy and plot it as a chart.
We can use it as a reference to whether we follow the original trading signals or not.
Introduction
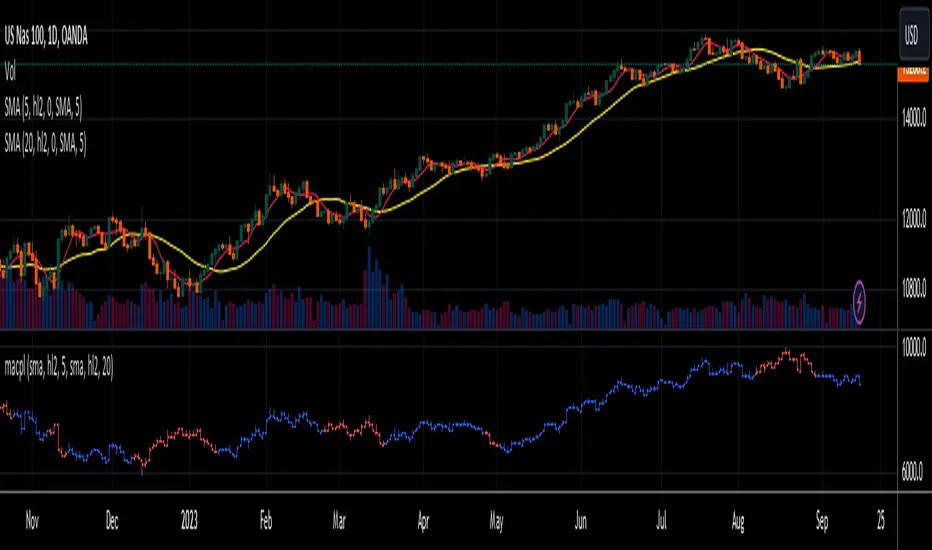
Moving average cross is a popular trading strategy.
The strategy suggests traders buy when the short term moving average is above the long term moving average and sell when the short term moving average is below the long term moving average.
However, just like the most technical indicators, the signals are not always accurate.
This problem causes traders don't have sufficient confidence to trade with these signals.
On the other hand, the natural risk management suggests us only invest after major risks are past.
Therefore, we wait until many counterexamples of trading signals are past.
What will happen if we imagine that following a specific trading signal is a fund?
We can evaluate the potential trading proceeding and loss and plot it as a chart.
And then, we can measure how much loss may encounter in many worst cases and regard it as a reference to whether we follow the original trading signals or not.
How it works
1. Determine the instruments and time frames we are interested in.
2. Determine the long term moving average and the short term moving average.
3. The strategy suggests traders buy when the short term moving average is above the long term moving average and sell when the short term moving average is below the long term moving average.
4. The potential trading proceeding and loss is plotted as a chart.
5. There are two colors in the chart. One is when the short term moving average is above the long term moving average and the other is when the short term moving average is below the long term moving average.
6. We can observe the local maximum and the local minimum or apply other indicators we are interested in on the numbers it provides.
Parameters
x_type1 = How to compute the short term moving average. The option diff means the price several days ago.
x_src1 = How to summarize the price of a trading day. It depends on the open, high, low or close prices.
x_ma1 = How many days included in the short term moving average. When it is 1, the signal becomes when the price is above or below a single moving average.
x_type2 = How to compute the long term moving average
x_src2 = How to summarize the price of a trading day. It depends on the open, high, low or close prices.
x_ma2 = How many days included in the long term moving average
Conclusion
This indicator can quantize the potential trading proceeding and loss and can imply when following the original trading signals is good or not.
Combining the instruments which are long term investible and use this indicator to avoid potential risks, we can make proceeding better than holding the major stock markets.
This script evaluates the potential trading proceeding and loss of the moving average cross strategy and plot it as a chart.
We can use it as a reference to whether we follow the original trading signals or not.
Introduction
Moving average cross is a popular trading strategy.
The strategy suggests traders buy when the short term moving average is above the long term moving average and sell when the short term moving average is below the long term moving average.
However, just like the most technical indicators, the signals are not always accurate.
This problem causes traders don't have sufficient confidence to trade with these signals.
On the other hand, the natural risk management suggests us only invest after major risks are past.
Therefore, we wait until many counterexamples of trading signals are past.
What will happen if we imagine that following a specific trading signal is a fund?
We can evaluate the potential trading proceeding and loss and plot it as a chart.
And then, we can measure how much loss may encounter in many worst cases and regard it as a reference to whether we follow the original trading signals or not.
How it works
1. Determine the instruments and time frames we are interested in.
2. Determine the long term moving average and the short term moving average.
3. The strategy suggests traders buy when the short term moving average is above the long term moving average and sell when the short term moving average is below the long term moving average.
4. The potential trading proceeding and loss is plotted as a chart.
5. There are two colors in the chart. One is when the short term moving average is above the long term moving average and the other is when the short term moving average is below the long term moving average.
6. We can observe the local maximum and the local minimum or apply other indicators we are interested in on the numbers it provides.
Parameters
x_type1 = How to compute the short term moving average. The option diff means the price several days ago.
x_src1 = How to summarize the price of a trading day. It depends on the open, high, low or close prices.
x_ma1 = How many days included in the short term moving average. When it is 1, the signal becomes when the price is above or below a single moving average.
x_type2 = How to compute the long term moving average
x_src2 = How to summarize the price of a trading day. It depends on the open, high, low or close prices.
x_ma2 = How many days included in the long term moving average
Conclusion
This indicator can quantize the potential trading proceeding and loss and can imply when following the original trading signals is good or not.
Combining the instruments which are long term investible and use this indicator to avoid potential risks, we can make proceeding better than holding the major stock markets.
Mã nguồn mở
Theo đúng tinh thần TradingView, tác giả của tập lệnh này đã công bố nó dưới dạng mã nguồn mở, để các nhà giao dịch có thể xem xét và xác minh chức năng. Chúc mừng tác giả! Mặc dù bạn có thể sử dụng miễn phí, hãy nhớ rằng việc công bố lại mã phải tuân theo Nội Quy.
Thông báo miễn trừ trách nhiệm
Thông tin và các ấn phẩm này không nhằm mục đích, và không cấu thành, lời khuyên hoặc khuyến nghị về tài chính, đầu tư, giao dịch hay các loại khác do TradingView cung cấp hoặc xác nhận. Đọc thêm tại Điều khoản Sử dụng.