OPEN-SOURCE SCRIPT
VIX Spike Strategy
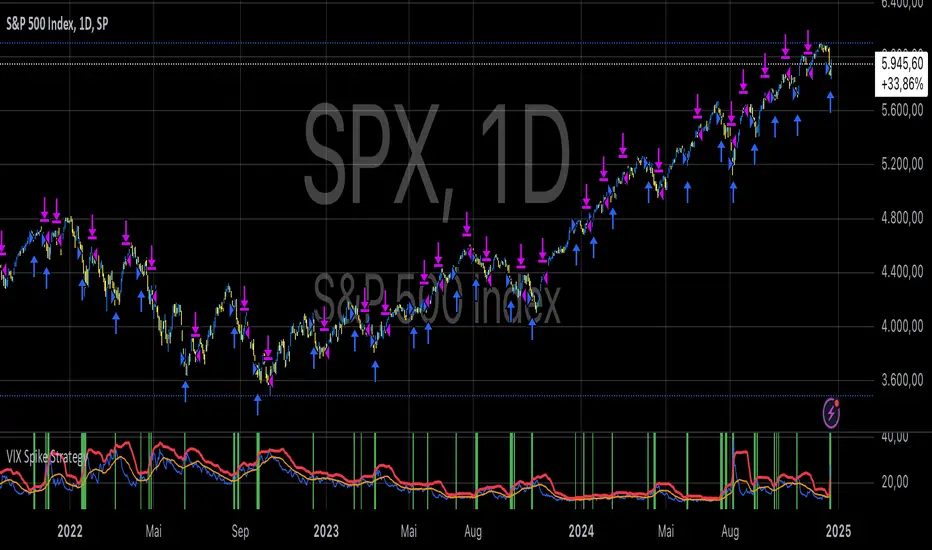
This script implements a trading strategy based on the Volatility Index (VIX) and its standard deviation. It aims to enter a long position when the VIX exceeds a certain number of standard deviations above its moving average, which is a signal of a volatility spike. The position is then exited after a set number of periods.
VIX Symbol (vix_symbol): The input allows the user to specify the symbol for the VIX index (typically "CBOE:VIX").
Standard Deviation Length (stddev_length): The number of periods used to calculate the standard deviation of the VIX. This can be adjusted by the user.
Standard Deviation Multiplier (stddev_multiple): This multiplier is used to determine how many standard deviations above the moving average the VIX must exceed to trigger a long entry.
Exit Periods (exit_periods): The user specifies how many periods after entering the position the strategy will exit the trade.
Strategy Logic:
Data Loading: The script loads the VIX data, both for the current timeframe and as a rescaled version for calculation purposes.
Standard Deviation Calculation: It calculates both the moving average (SMA) and the standard deviation of the VIX over the specified period (stddev_length).
Entry Condition: A long position is entered when the VIX exceeds the moving average by a specified multiple of its standard deviation (calculated as vix_mean + stddev_multiple * vix_stddev).
Exit Condition: After the position is entered, it will be closed after the user-defined number of periods (exit_periods).
Visualization:
The VIX is plotted in blue.
The moving average of the VIX is plotted in orange.
The threshold for the VIX, which is the moving average plus the standard deviation multiplier, is plotted in red.
The background turns green when the entry condition is met, providing a visual cue.
Sources:
The VIX is often used as a measure of market volatility, with high values indicating increased uncertainty in the market.
Standard deviation is a statistical measure of the variability or dispersion of a set of data points. In financial markets, it is used to measure the volatility of asset prices.
References:
Bollerslev, T. (1986). "Generalized Autoregressive Conditional Heteroskedasticity." Journal of Econometrics.
Black, F., & Scholes, M. (1973). "The Pricing of Options and Corporate Liabilities." Journal of Political Economy.
Mã nguồn mở
Theo đúng tinh thần TradingView, tác giả của tập lệnh này đã công bố nó dưới dạng mã nguồn mở, để các nhà giao dịch có thể xem xét và xác minh chức năng. Chúc mừng tác giả! Mặc dù bạn có thể sử dụng miễn phí, hãy nhớ rằng việc công bố lại mã phải tuân theo Nội quy.
Where others speculate, we systematize.
edgetools.org
edgetools.org
Thông báo miễn trừ trách nhiệm
Thông tin và các ấn phẩm này không nhằm mục đích, và không cấu thành, lời khuyên hoặc khuyến nghị về tài chính, đầu tư, giao dịch hay các loại khác do TradingView cung cấp hoặc xác nhận. Đọc thêm tại Điều khoản Sử dụng.