OPEN-SOURCE SCRIPT
Combined SMA with Murrey Math and Fixed Fractal Bands
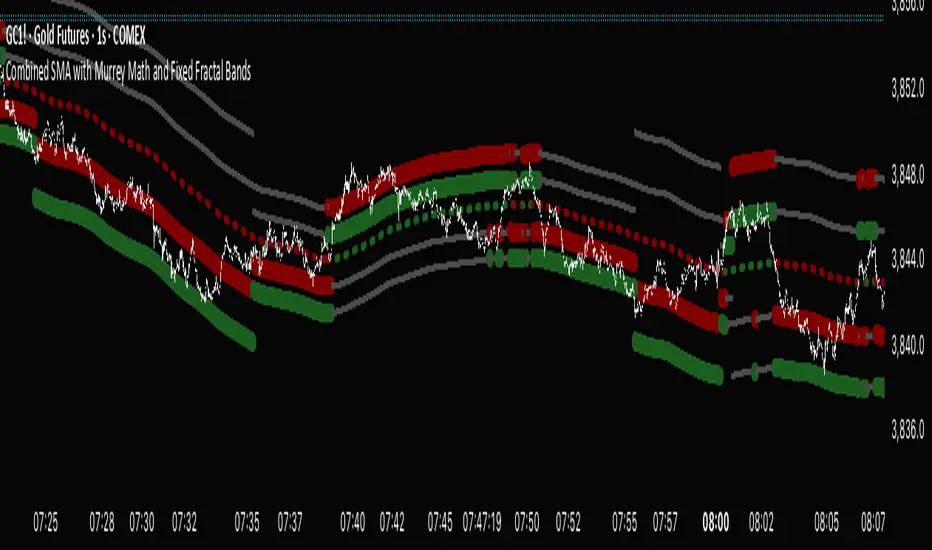
"Combined SMA with Murrey Math and Fixed Fractal Bands" , overlaying a Simple Moving Average (SMA), Murrey Math (MM) bands, and fixed fractal bands on a price chart. Here's a brief description of its functionality:Inputs:SMA Length: Configurable period for the SMA (default: 180 bars).
Resolution: Optional custom timeframe for data.
Frame Size for MM: Lookback period for Murrey Math calculations (default: 180 bars, adjustable via multiplier).
Ignore Wicks: Option to use open/close prices instead of high/low for MM calculations.
Fixed Fractal Size: Fixed distance in points for fractal bands (default: 1.22).
Shade 3/8-5/8 Overlap: Option to highlight overlapping regions between SMA-centered and absolute MM bands.
Data Source:Uses open, close, high, and low prices from the specified ticker and timeframe.
Optionally ignores wicks (high/low) for MM calculations, using max/min of open/close instead.
SMA Calculation:Computes a Simple Moving Average (SMA) based on the closing price and user-defined length.
Murrey Math Bands:Absolute MM Bands: Calculated using a dynamic range based on the highest/lowest prices over a lookback period, scaled logarithmically to create 13 levels (from -3/8 to +3/8, with 8/8 as the midpoint). These adapt to price action.
SMA-Centered MM Bands: Constructs MM bands relative to the SMA, with levels (0/8 to 8/8) spaced by a calculated increment derived from the absolute MM range.
Colors bands dynamically (green for bullish, red for bearish, gray for neutral) based on changes in the 4/8 level or increment, with labels indicating "Higher," "Lower," or "Same" states.
Fixed Fractal Bands:Plots six fixed-distance bands (±1, ±2, ±3) around the SMA, using a user-defined point value (default: 1.22).
Overlaps and Shading:Detects overlaps between SMA-centered and absolute MM bands at key levels (7/8-8/8, 0/8-1/8, and optionally 3/8-5/8).
Shades overlapping regions with distinct colors (red for 7/8-8/8, green for 0/8-1/8, blue for 3/8-5/8).
Fills specific SMA-centered MM regions (3/8-5/8, 0/8-1/8, 7/8-8/8) for visual emphasis.
Visualization:Plots SMA-centered MM bands, absolute MM bands, and fixed fractal bands as stepped lines with varying colors and transparency.
Displays a table at the bottom-right showing the current MM increment value.
Adds labels when the 4/8 level or increment changes, indicating trend direction.
In summary, this indicator combines a user-defined SMA with Murrey Math bands (both absolute and SMA-centered) and fixed fractal bands to provide a multi-level support/resistance framework. It highlights dynamic price levels, trend direction, and key overlaps, aiding traders in identifying potential reversal or consolidation zones.
Mã nguồn mở
Theo đúng tinh thần TradingView, tác giả của tập lệnh này đã công bố nó dưới dạng mã nguồn mở, để các nhà giao dịch có thể xem xét và xác minh chức năng. Chúc mừng tác giả! Mặc dù bạn có thể sử dụng miễn phí, hãy nhớ rằng việc công bố lại mã phải tuân theo Nội quy.
Thông báo miễn trừ trách nhiệm
Thông tin và các ấn phẩm này không nhằm mục đích, và không cấu thành, lời khuyên hoặc khuyến nghị về tài chính, đầu tư, giao dịch hay các loại khác do TradingView cung cấp hoặc xác nhận. Đọc thêm tại Điều khoản Sử dụng.