OPEN-SOURCE SCRIPT
TMA All in One
Triangular Moving Averages
TMA formula is prepared on the Tradingview so that everyone can easly access.
First, calculate the simple moving average ( SMA ):
SMA = (P1 + P2 + P3 + P4 + ... + PN ) / N
Then, take the average of all the SMA values to get TMA values.
TMA = (SMA1 + SMA2 + SMA3 + SMA4 + ... SMAN) / N
The TMA can also be expressed
Source : Close
if the prices are upper than moving averages price bar color will be green, if lower than moving average it will be red color.
İf the trend is bullish , TMA will work as support
İf the trend is bear, TMA will work as resistance..

We used SMA5 ( Simple Moving Average5)
İf short period average(Green), cross up Longterm average (brown) that means BUY ( Green area)
İf opposite SELL ( Red area)

My idea, weekly period gives very good results to middleterm and long term invesment..That can help us from which prices we can buy the stock which we think that financial results are positive..
The other topic;
At the end, everytime prices return back to average values, and prices can move away until some distance. We can buy or sell with mixed prices, that can provide us better buy or sell average cost.
in Default Settings;
SELL 2.Area = 20% over than Longterm average, if the prices go upper that means prices are increased so much
SELL 1.Area = 13% over than Longterm average, if the prices go upper that means prices are incresed a bit.
BUY 1.Area = 3% lower than Longterm average, if the prices go upper that means prices are decreased a bit.
BUY 2.Area = 10% lower than Longterm average, f the prices go upper that means prices are decreased so much

You can use this indicator in your interested stock market.. With checking historical behaviour of the related stock market, you can make balance on the indicator setting.
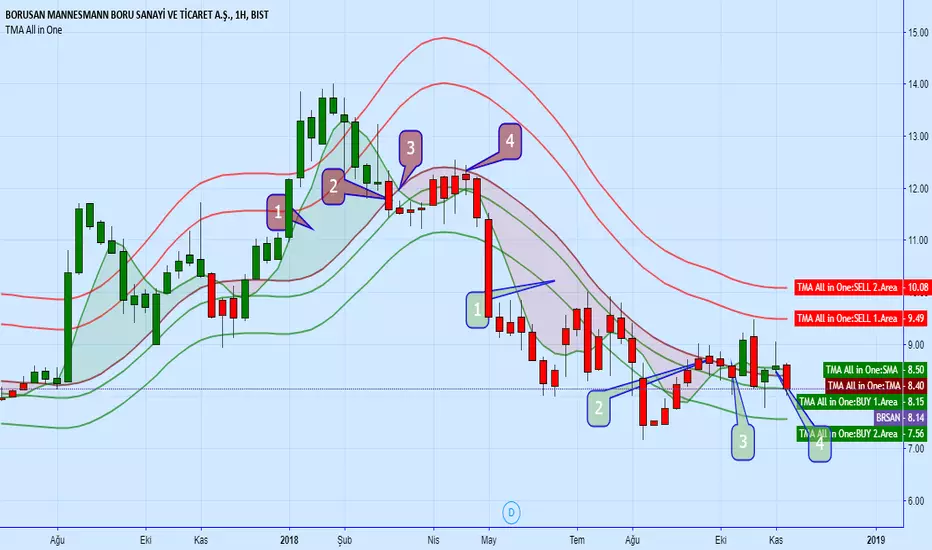
According to averages, below BUY-SELL strategy is important,
Powerful SELL
1- Previosly İncrease
2- Price cross down the long average line
3- Short average,crossdown the long average
4- Price approach to long average, but close the bar under this average
Powerful BUY
1. Previosly Decrease
2. Price cross up the long average line
3. Short average crossup the long average line
4. Price approach to long average, but close the bar over this average
TMA formula is prepared on the Tradingview so that everyone can easly access.
First, calculate the simple moving average ( SMA ):
SMA = (P1 + P2 + P3 + P4 + ... + PN ) / N
Then, take the average of all the SMA values to get TMA values.
TMA = (SMA1 + SMA2 + SMA3 + SMA4 + ... SMAN) / N
The TMA can also be expressed
Source : Close
if the prices are upper than moving averages price bar color will be green, if lower than moving average it will be red color.
İf the trend is bullish , TMA will work as support
İf the trend is bear, TMA will work as resistance..
We used SMA5 ( Simple Moving Average5)
İf short period average(Green), cross up Longterm average (brown) that means BUY ( Green area)
İf opposite SELL ( Red area)
My idea, weekly period gives very good results to middleterm and long term invesment..That can help us from which prices we can buy the stock which we think that financial results are positive..
The other topic;
At the end, everytime prices return back to average values, and prices can move away until some distance. We can buy or sell with mixed prices, that can provide us better buy or sell average cost.
in Default Settings;
SELL 2.Area = 20% over than Longterm average, if the prices go upper that means prices are increased so much
SELL 1.Area = 13% over than Longterm average, if the prices go upper that means prices are incresed a bit.
BUY 1.Area = 3% lower than Longterm average, if the prices go upper that means prices are decreased a bit.
BUY 2.Area = 10% lower than Longterm average, f the prices go upper that means prices are decreased so much
You can use this indicator in your interested stock market.. With checking historical behaviour of the related stock market, you can make balance on the indicator setting.
According to averages, below BUY-SELL strategy is important,
Powerful SELL
1- Previosly İncrease
2- Price cross down the long average line
3- Short average,crossdown the long average
4- Price approach to long average, but close the bar under this average
Powerful BUY
1. Previosly Decrease
2. Price cross up the long average line
3. Short average crossup the long average line
4. Price approach to long average, but close the bar over this average
Mã nguồn mở
Theo đúng tinh thần TradingView, tác giả của tập lệnh này đã công bố nó dưới dạng mã nguồn mở, để các nhà giao dịch có thể xem xét và xác minh chức năng. Chúc mừng tác giả! Mặc dù bạn có thể sử dụng miễn phí, hãy nhớ rằng việc công bố lại mã phải tuân theo Nội quy.
Thông báo miễn trừ trách nhiệm
Thông tin và các ấn phẩm này không nhằm mục đích, và không cấu thành, lời khuyên hoặc khuyến nghị về tài chính, đầu tư, giao dịch hay các loại khác do TradingView cung cấp hoặc xác nhận. Đọc thêm tại Điều khoản Sử dụng.