OPEN-SOURCE SCRIPT
Daily ATR Tracker
Daily ATR Tracker
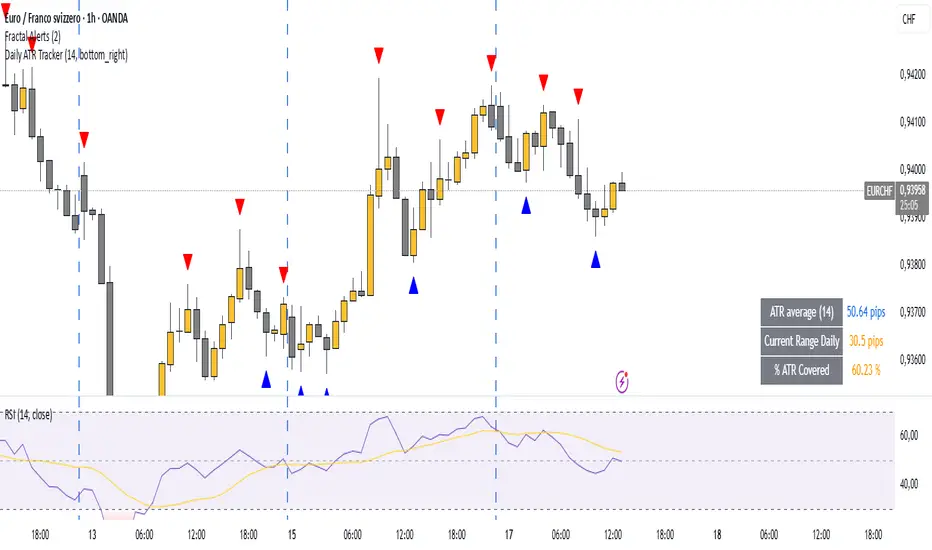
The Daily ATR Tracker is a simple yet powerful tool designed to help traders monitor the daily price movement relative to the average daily range (ATR). This indicator provides an objective view of how much price has moved compared to its recent daily volatility.
🔎 Key Features:
Customizable ATR period (default 14 days)
Live calculation of the current day's price range
ATR value displayed in pips for clear reference
Percentage of ATR covered by the current day's range
Color-coded table for quick visual interpretation:
🟢 Green: less than 60% of ATR covered
🟠 Orange: 60% to 100% of ATR covered
🔴 Red: more than 100% of ATR covered
Alert condition when daily range exceeds 100% of the ATR average
Movable table position to fit your chart layout
🎯 Why use Daily ATR Tracker?
✅ Identify exhaustion zones: When price has already covered a large portion of its typical daily range, the odds of further strong movement may diminish, helping you to manage entries, exits, and risk.
✅ Objective daily bias: Get a quantitative sense of how "stretched" the market is in real time.
✅ Works with any timeframe: While designed for daily ranges, you can monitor intraday movements with this context in mind.
⚠️ Usage Note:
This tool does not provide buy or sell signals by itself. It is designed to complement your existing strategies by offering additional context regarding daily range exhaustion.
Mã nguồn mở
Theo đúng tinh thần TradingView, tác giả của tập lệnh này đã công bố nó dưới dạng mã nguồn mở, để các nhà giao dịch có thể xem xét và xác minh chức năng. Chúc mừng tác giả! Mặc dù bạn có thể sử dụng miễn phí, hãy nhớ rằng việc công bố lại mã phải tuân theo Nội quy.
Thông báo miễn trừ trách nhiệm
Thông tin và các ấn phẩm này không nhằm mục đích, và không cấu thành, lời khuyên hoặc khuyến nghị về tài chính, đầu tư, giao dịch hay các loại khác do TradingView cung cấp hoặc xác nhận. Đọc thêm tại Điều khoản Sử dụng.