OPEN-SOURCE SCRIPT
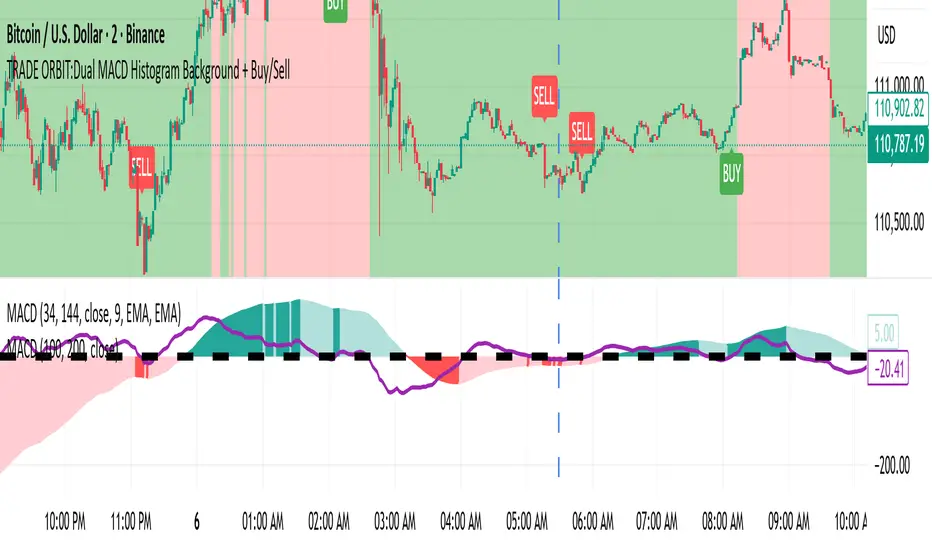
TRADE ORBIT:Dual MACD Histogram Background + Buy/Sell
Description:
This indicator combines two MACD systems to provide clear trend, buy/sell signals, and identifies potential discount and premium zones for smarter entries and exits.
Features:
MACD #1 (100, 200, 50) – Trend & Background Coloring
Histogram > 0 → Green background (Bullish trend)
Histogram < 0 → Red background (Bearish trend)
MACD #2 (34, 144, 9) – Buy/Sell Signals
Buy Signal: Histogram crosses above zero and MACD #1 background is green
Sell Signal: Histogram crosses below zero and MACD #1 background is red
Signals are plotted as tiny labels directly on the chart
Discount & Premium Zones
Discount Zone: Price below MACD #1 slow EMA → highlighted in green
Premium Zone: Price above MACD #1 slow EMA → highlighted in red
Helps identify “cheap” (potential buy) and “expensive” (potential sell) areas relative to trend
Reference Plots (Optional)
MACD #1 & #2 histograms plotted as columns for visual confirmation
Usage:
Use MACD #1 background to identify the prevailing trend.
Wait for MACD #2 cross signals aligned with trend for buy/sell confirmation.
Discount and premium zones help time entries and exits more efficiently.
Ideal For:
Swing traders and position traders who want to combine trend-following signals with overbought/oversold zones.
Mã nguồn mở
Theo đúng tinh thần TradingView, người tạo ra tập lệnh này đã biến tập lệnh thành mã nguồn mở để các nhà giao dịch có thể xem xét và xác minh công năng. Xin dành lời khen tặng cho tác giả! Mặc dù bạn có thể sử dụng miễn phí, nhưng lưu ý nếu đăng lại mã, bạn phải tuân theo Quy tắc nội bộ của chúng tôi.
Thông báo miễn trừ trách nhiệm
Thông tin và ấn phẩm không có nghĩa là và không cấu thành, tài chính, đầu tư, kinh doanh, hoặc các loại lời khuyên hoặc khuyến nghị khác được cung cấp hoặc xác nhận bởi TradingView. Đọc thêm trong Điều khoản sử dụng.