OPEN-SOURCE SCRIPT
Cập nhật AWR Optimized LR Graph
Hello Trading Viewers !
Drawing linear regression channels at the best place and for many periods can be time consuming.
In the library, I've found some indicators that draw 1 or 2 but based on fixed number of bars or a duration...
Not always relevant, that's why I decide to create this indicator.
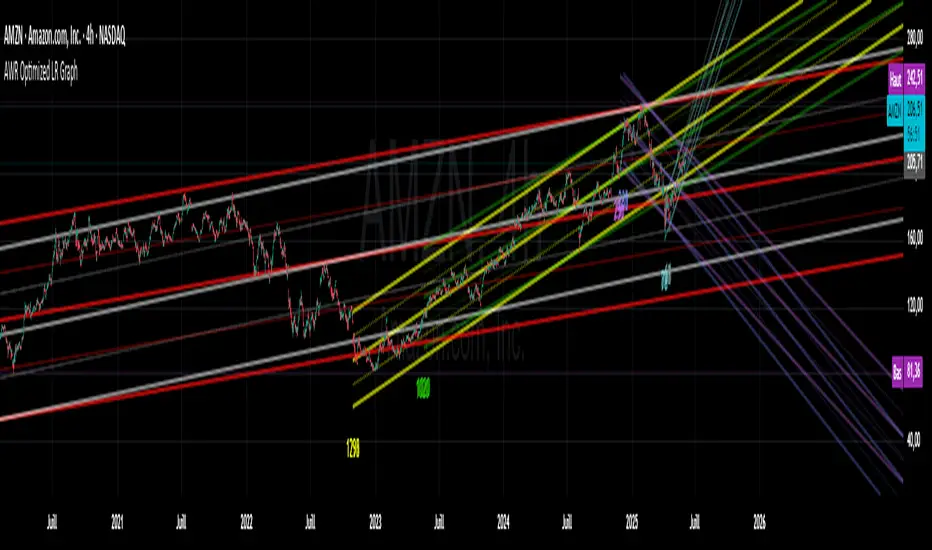
It calculates 8 linear regression channels according to 8 differents configurable periods.
Each time, the indicator will calculate for each specified duration range the best linear regression line & channel (2 standard regressions) for that period and then plot it on the graph.
You can settle how many linear regression channels you want to display.
For period, defaults configurations (number of candles studied) are :
Period 1
min1 = 33
max1 = 66
Period 2
min2 = 67
max2 = 128
Period 3
min3 = 129
max3 = 255
Period 4
min4 = 256
max4 = 510
Period 5
min5 = 511
max5 = 1020
Period 6
min6 = 1021
max6 = 2040
Period 7
min7 = 2041
max7 = 3500
Period 8
min8 = 3501
max8 = 4999
This default settings provide short-term, mid term, long term and a very long-term view.
You have to go back on the chart to display the channels that start on previous period that are currently not on the screen.
You can set a specific color for each linear regression channels.
The linear regression line is based on the least squares method, meaning: it calculates along each period the gap between a linear & the price & squarred it. Then it defines the linear in order to have always the least distance between price and the linear.
The more the price deviates from its regression line, the more statistically likely it is to return to its regression line.
Application of Regression Lines in Trading
Regression lines are widely used in trading and financial analysis to understand market trends and make informed predictions. Here are some key applications:
1. Trend Identification – Traders use regression lines to visualize the general direction of a stock or asset price, helping to confirm an upward or downward trend.
2. Price Predictions – Linear regression models assist in estimating future price movements based on historical data, allowing traders to anticipate changes.
3. Risk Assessment – By analyzing the slope and variation of a regression line, traders can gauge market volatility and potential risks.
4. Support and Resistance Levels – Regression channels help traders identify support and resistance zones, providing insight into optimal entry and exit points in a trend.
5. You can also use the short period linear regression channels vs the long period linear regression channels to identify important pivot points.
Drawing linear regression channels at the best place and for many periods can be time consuming.
In the library, I've found some indicators that draw 1 or 2 but based on fixed number of bars or a duration...
Not always relevant, that's why I decide to create this indicator.
It calculates 8 linear regression channels according to 8 differents configurable periods.
Each time, the indicator will calculate for each specified duration range the best linear regression line & channel (2 standard regressions) for that period and then plot it on the graph.
You can settle how many linear regression channels you want to display.
For period, defaults configurations (number of candles studied) are :
Period 1
min1 = 33
max1 = 66
Period 2
min2 = 67
max2 = 128
Period 3
min3 = 129
max3 = 255
Period 4
min4 = 256
max4 = 510
Period 5
min5 = 511
max5 = 1020
Period 6
min6 = 1021
max6 = 2040
Period 7
min7 = 2041
max7 = 3500
Period 8
min8 = 3501
max8 = 4999
This default settings provide short-term, mid term, long term and a very long-term view.
You have to go back on the chart to display the channels that start on previous period that are currently not on the screen.
You can set a specific color for each linear regression channels.
The linear regression line is based on the least squares method, meaning: it calculates along each period the gap between a linear & the price & squarred it. Then it defines the linear in order to have always the least distance between price and the linear.
The more the price deviates from its regression line, the more statistically likely it is to return to its regression line.
Application of Regression Lines in Trading
Regression lines are widely used in trading and financial analysis to understand market trends and make informed predictions. Here are some key applications:
1. Trend Identification – Traders use regression lines to visualize the general direction of a stock or asset price, helping to confirm an upward or downward trend.
2. Price Predictions – Linear regression models assist in estimating future price movements based on historical data, allowing traders to anticipate changes.
3. Risk Assessment – By analyzing the slope and variation of a regression line, traders can gauge market volatility and potential risks.
4. Support and Resistance Levels – Regression channels help traders identify support and resistance zones, providing insight into optimal entry and exit points in a trend.
5. You can also use the short period linear regression channels vs the long period linear regression channels to identify important pivot points.
Phát hành các Ghi chú
Minor changesAdd alerts & bg colors options when prices is outside channels
Phát hành các Ghi chú
Small adjustmentsMã nguồn mở
Theo đúng tinh thần TradingView, tác giả của tập lệnh này đã công bố nó dưới dạng mã nguồn mở, để các nhà giao dịch có thể xem xét và xác minh chức năng. Chúc mừng tác giả! Mặc dù bạn có thể sử dụng miễn phí, hãy nhớ rằng việc công bố lại mã phải tuân theo Nội quy.
Thông báo miễn trừ trách nhiệm
Thông tin và các ấn phẩm này không nhằm mục đích, và không cấu thành, lời khuyên hoặc khuyến nghị về tài chính, đầu tư, giao dịch hay các loại khác do TradingView cung cấp hoặc xác nhận. Đọc thêm tại Điều khoản Sử dụng.
Mã nguồn mở
Theo đúng tinh thần TradingView, tác giả của tập lệnh này đã công bố nó dưới dạng mã nguồn mở, để các nhà giao dịch có thể xem xét và xác minh chức năng. Chúc mừng tác giả! Mặc dù bạn có thể sử dụng miễn phí, hãy nhớ rằng việc công bố lại mã phải tuân theo Nội quy.
Thông báo miễn trừ trách nhiệm
Thông tin và các ấn phẩm này không nhằm mục đích, và không cấu thành, lời khuyên hoặc khuyến nghị về tài chính, đầu tư, giao dịch hay các loại khác do TradingView cung cấp hoặc xác nhận. Đọc thêm tại Điều khoản Sử dụng.