OPEN-SOURCE SCRIPT
Dynamic Price Channels
Cập nhật
This indicator plots dynamic price channels based on the security highest close and lowest open.
The default is to display 8 core channels (with the option to plot the sub channel lines, off by default).
It’s simple really—this just divides the price action into equal channels. I’ve found this pattern helpful across all markets.
It’s dynamic because if a new high close or a new low close is created the all channels will adjust.
What you’ll typically see at these channel boundaries are price slow downs, reversals, support and resistance.
Turning on sub-channels will provide further channel plots. On these sub-channels you’ll also see the same type of price action activity as mentioned above.
I’ve developed a trading system where this indicator helps identify key pivot areas. Combined with a few other indicators and key EMAs this trade system provides high probability trades around these key channel areas.
The default is to display 8 core channels (with the option to plot the sub channel lines, off by default).
It’s simple really—this just divides the price action into equal channels. I’ve found this pattern helpful across all markets.
It’s dynamic because if a new high close or a new low close is created the all channels will adjust.
- The key levels are 75% (blue), 50% (aqua), 25% (blue).
- In between those key levels is a level separator.
- The high close and the low open are both red.
- These can all be customized in the settings.
What you’ll typically see at these channel boundaries are price slow downs, reversals, support and resistance.
Turning on sub-channels will provide further channel plots. On these sub-channels you’ll also see the same type of price action activity as mentioned above.
I’ve developed a trading system where this indicator helps identify key pivot areas. Combined with a few other indicators and key EMAs this trade system provides high probability trades around these key channel areas.
Phát hành các Ghi chú
Added the ability to change resolution and some usability updates.- Resolution can now be selected (default is daily). See below how this might be helpful
- Added check box to ignore resolution. If that is clicked it channels will be drawn from the highest close and the lowest close
- Added the ability to quickly change colors of different channel lines (you can still change individually this just makes it easier to change all to one color)
With resolution. If you use anything less than a day typically the lookback on the chart will reduce. Choose the 5min resolution to see how this works. I've found it provides some additional results and draws tighter channels because it's starting from a later date.
Phát hành các Ghi chú
Added the ability to have dynamic channels drawn on either the Weekly or Daily high and low.There's 2 additional checkboxes in this release and only one of them can be selected or will be used.
If you select the Daily it will plot dynamic channels for each individual day. If you select Weekly (unselect daily) it will plot weekly channels.
If you don't choose either one of these you can select the resolution and a full chart calculation will be used based on the resolution you select.
Clicking below that will ignore that calculation and will use all available data for that chart to plot dynamic channels.
Phát hành các Ghi chú
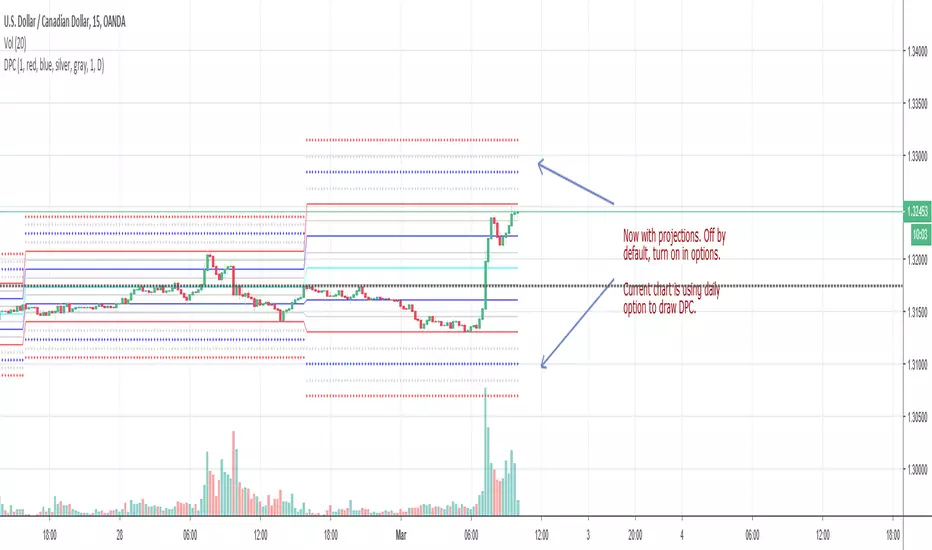
This update has the option to plot projections.Projections are plotted on the top and bottom with plus symbol.
It only plots one channel up and colors are the same as what is selected for the main channels.
Keep in mind this adjusts as price makes new lows or new highs.
Marking the projections on a chart as price moves in that direction is how I've found this most helpful. It's really helped in scalping in both the FOREX and Crypto market.
Mã nguồn mở
Theo tinh thần TradingView thực sự, tác giả của tập lệnh này đã xuất bản dưới dạng nguồn mở để các nhà giao dịch có thể hiểu và xác minh. Chúc mừng tác giả! Bạn có thể sử dụng miễn phí. Tuy nhiên, bạn cần sử dụng lại mã này theo Quy tắc nội bộ. Bạn có thể yêu thích nó để sử dụng nó trên biểu đồ.
Get the best... join my Discord: discord.gg/WgjsxVz
Thông báo miễn trừ trách nhiệm
Thông tin và ấn phẩm không có nghĩa là và không cấu thành, tài chính, đầu tư, kinh doanh, hoặc các loại lời khuyên hoặc khuyến nghị khác được cung cấp hoặc xác nhận bởi TradingView. Đọc thêm trong Điều khoản sử dụng.