OPEN-SOURCE SCRIPT
Custom Group Financials [Technimentals]
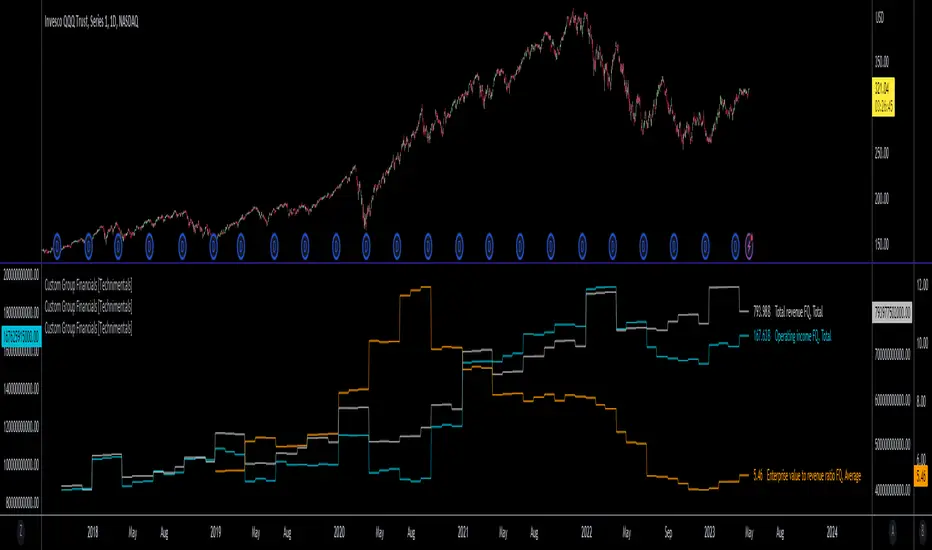
This script allows the user to build custom groups and combine the same financial data from 40 different symbols simultaneously and plot it data as a total or as an average.
By default, the top 40 symbols in the QQQ are used. Between them they account for the majority of the index. This is a good workaround for the lack of ETF financial data in TradingView.
This functions much like any other financial indicator. You choose the financial data and period:
FY = Financial Year
FQ = Financial Quarter
TTM = Trailing Twelve Months
Bare in mind that some data only exists in FY data.
Thanks to LucF for writing most of this code!
Enjoy!
Mã nguồn mở
Theo đúng tinh thần TradingView, tác giả của tập lệnh này đã công bố nó dưới dạng mã nguồn mở, để các nhà giao dịch có thể xem xét và xác minh chức năng. Chúc mừng tác giả! Mặc dù bạn có thể sử dụng miễn phí, hãy nhớ rằng việc công bố lại mã phải tuân theo Nội quy.
Thông báo miễn trừ trách nhiệm
Thông tin và các ấn phẩm này không nhằm mục đích, và không cấu thành, lời khuyên hoặc khuyến nghị về tài chính, đầu tư, giao dịch hay các loại khác do TradingView cung cấp hoặc xác nhận. Đọc thêm tại Điều khoản Sử dụng.