OPEN-SOURCE SCRIPT
HL/OL Histogram + (Close-Open)

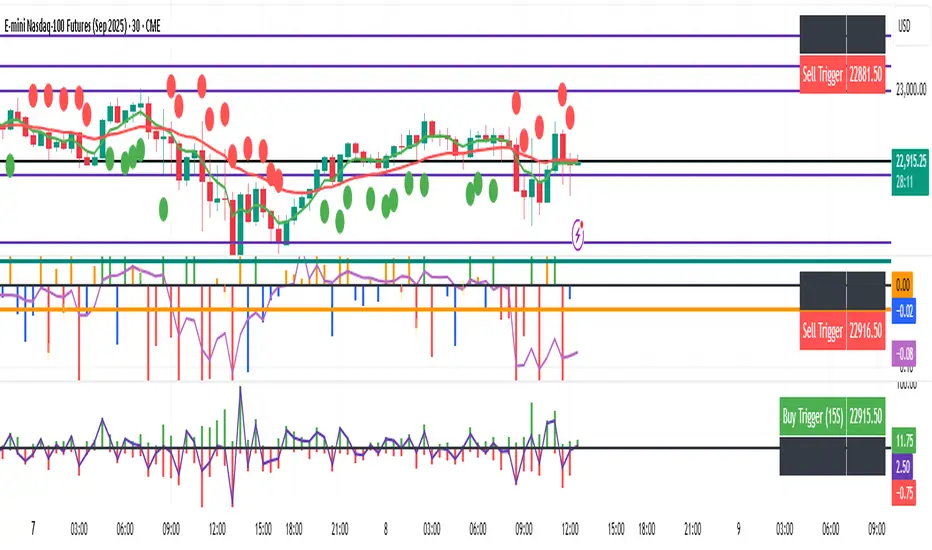
🧠 Core Concept
This indicator is designed to detect meaningful directional intent in price action using a combination of:
Intrabar candle structure (high - open, open - low)
Net price momentum (close - open)
Timed trigger levels (frozen buy/sell prices based on selected timeframe closes)
The core idea is to visually separate bullish and bearish energy in the current bar, and to mark the price at which momentum flips from down to up or vice versa, based on a change in the close - open differential.
🔍 Components Breakdown
1. Histogram Bars
Green Bars (high - open): Represent bullish upper wicks, showing intrabar strength above the open.
Red Bars (open - low): Represent bearish lower wicks, showing pressure below the open.
Plotted as histograms above and below the zero line.
2. Close–Open Line (White)
Plots the difference between close and open for each bar.
Helps you visually track when momentum flips from negative to positive, or vice versa.
A bold black zero line provides clear reference for these flips.
3. Buy/Sell Signal Logic
A Buy Trigger is generated when close - open crosses above zero
A Sell Trigger occurs when close - open crosses below zero
These trigger events are one-shot, meaning they’re only registered once per signal direction. No retriggers occur until the opposite condition is met.
📈 Trigger Price Table (Static)
On a signal trigger, the close price from a lower timeframe (15S, 30S, 1, 2, 3, or 5 min) is captured.
This price is frozen and displayed in a table at the top-right of the pane.
The price remains fixed until the opposite trigger condition fires, at which point it is replaced.
Why close price?
Using the close from the lower timeframe gives a precise, decisive reference point — ideal for planning limit entries or confirming breakout commitment.
🛠️ Use Cases
Momentum traders can use the histogram and line to time entries after strong open rejection or close breakouts.
Scalpers can quickly gauge intrabar sentiment reversals and react to new momentum without waiting for candle closes.
Algo builders can use the frozen price logic as precise entry or confirmation points in automated strategies.
Mã nguồn mở
Theo đúng tinh thần TradingView, tác giả của tập lệnh này đã công bố nó dưới dạng mã nguồn mở, để các nhà giao dịch có thể xem xét và xác minh chức năng. Chúc mừng tác giả! Mặc dù bạn có thể sử dụng miễn phí, hãy nhớ rằng việc công bố lại mã phải tuân theo Nội quy.
Thông báo miễn trừ trách nhiệm
Thông tin và các ấn phẩm này không nhằm mục đích, và không cấu thành, lời khuyên hoặc khuyến nghị về tài chính, đầu tư, giao dịch hay các loại khác do TradingView cung cấp hoặc xác nhận. Đọc thêm tại Điều khoản Sử dụng.