OPEN-SOURCE SCRIPT
Cập nhật True Range Osc
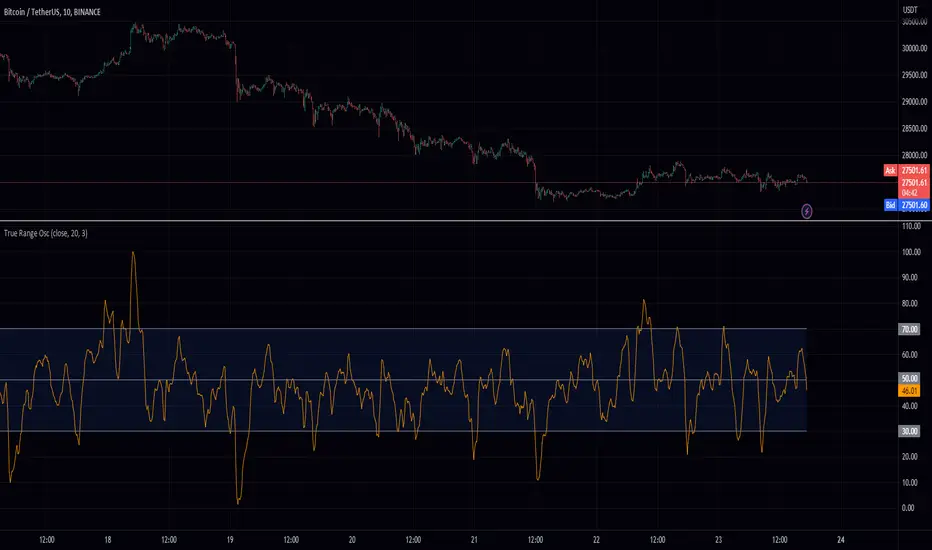
Hey fellow traders! I've just published a new indicator called the True Range Oscillator. It's designed to help you better understand price movements and volatility. The indicator calculates the average true range of the price data and uses a modified z-score-like approach to normalize it. The main difference is that it uses true range instead of standard deviation for normalization.
This oscillator identifies the highest and lowest values within a specified range, excluding any outliers based on standard deviations. It then scales the output between 0 and 100, so you can easily see how the current price action compares to its historical range. You can use the True Range Oscillator to spot potential trend reversals and overbought/oversold conditions.
Here are some features to explore:
Customize your price data source (open, high, low, or close).
Adjust the length and smoothing settings for the average true range calculation.
Find outliers with standard deviations, and tweak the outlier_level and dev_lookback options.
Visualize price action with plotted lines for the upper range (70), lower range (30), and center line (50), along with a shaded area between the upper and lower ranges for added clarity.
I hope you find this indicator useful in your trading journey!
Phát hành các Ghi chú
Fixed smoothingMã nguồn mở
Theo đúng tinh thần TradingView, tác giả của tập lệnh này đã công bố nó dưới dạng mã nguồn mở, để các nhà giao dịch có thể xem xét và xác minh chức năng. Chúc mừng tác giả! Mặc dù bạn có thể sử dụng miễn phí, hãy nhớ rằng việc công bố lại mã phải tuân theo Nội quy.
Thông báo miễn trừ trách nhiệm
Thông tin và các ấn phẩm này không nhằm mục đích, và không cấu thành, lời khuyên hoặc khuyến nghị về tài chính, đầu tư, giao dịch hay các loại khác do TradingView cung cấp hoặc xác nhận. Đọc thêm tại Điều khoản Sử dụng.
Mã nguồn mở
Theo đúng tinh thần TradingView, tác giả của tập lệnh này đã công bố nó dưới dạng mã nguồn mở, để các nhà giao dịch có thể xem xét và xác minh chức năng. Chúc mừng tác giả! Mặc dù bạn có thể sử dụng miễn phí, hãy nhớ rằng việc công bố lại mã phải tuân theo Nội quy.
Thông báo miễn trừ trách nhiệm
Thông tin và các ấn phẩm này không nhằm mục đích, và không cấu thành, lời khuyên hoặc khuyến nghị về tài chính, đầu tư, giao dịch hay các loại khác do TradingView cung cấp hoặc xác nhận. Đọc thêm tại Điều khoản Sử dụng.