OPEN-SOURCE SCRIPT
PowerXYZ Strategy (PowerX Modified)
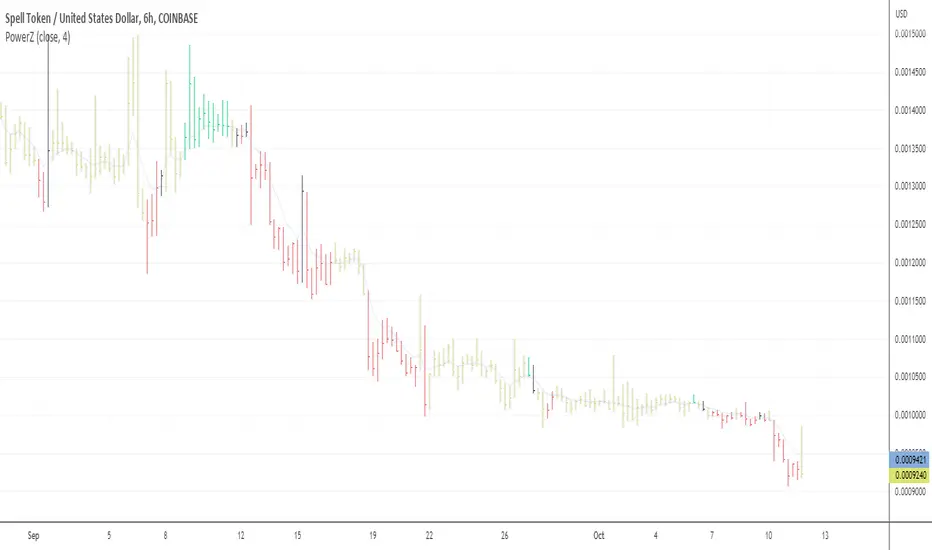
This script modifies the PowerX strategy in the following ways:
- there are two types of 'black' bars, yellow and black; the bars that are colored black indicate the flip of the RSI from positive to negative, and vise versa, while the signal is also near to green or red color; the close of these bars are a strong indication of support or resistance, and the previous closes behind these bars create S&D zones.
- compares the typical price to the 4-period smoothed moving average to generate yellow bars sooner at the end of trends.
- uses a signal line of > 49 and <= 49 instead of 50.
Yellow indicates that you should probably move your stop closer to the current price.
Black indicates that you should probably exit and look for a new entry, as it is a strong area of support or resistance.
Mã nguồn mở
Theo đúng tinh thần TradingView, tác giả của tập lệnh này đã công bố nó dưới dạng mã nguồn mở, để các nhà giao dịch có thể xem xét và xác minh chức năng. Chúc mừng tác giả! Mặc dù bạn có thể sử dụng miễn phí, hãy nhớ rằng việc công bố lại mã phải tuân theo Nội quy.
Thông báo miễn trừ trách nhiệm
Thông tin và các ấn phẩm này không nhằm mục đích, và không cấu thành, lời khuyên hoặc khuyến nghị về tài chính, đầu tư, giao dịch hay các loại khác do TradingView cung cấp hoặc xác nhận. Đọc thêm tại Điều khoản Sử dụng.