OPEN-SOURCE SCRIPT
2x ATR Horizontal Rays
2x ATR Horizontal Rays Indicator
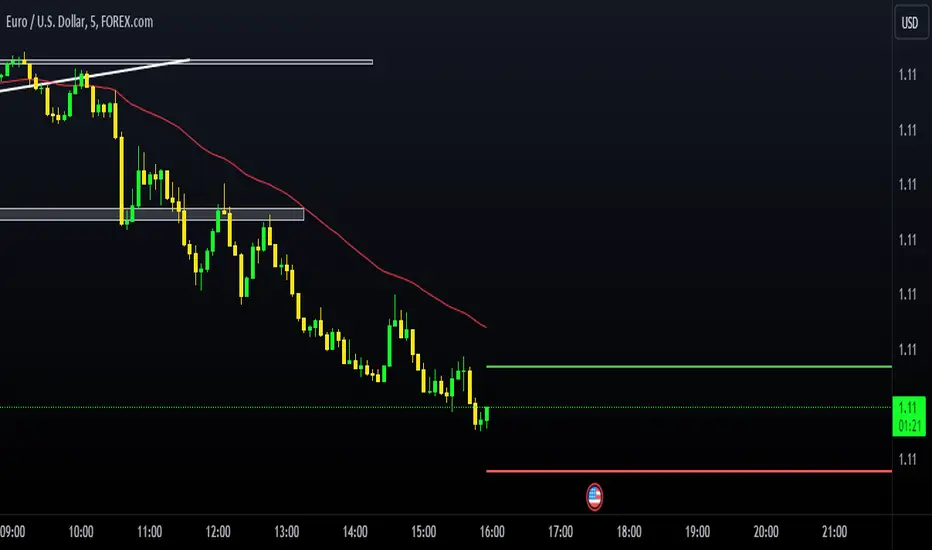
This script plots horizontal rays based on the 2x ATR (Average True Range) of the previous candle. It helps traders visualize key support and resistance levels by extending lines from the last candle's price, calculated with a 2x ATR multiplier. The indicator draws two lines:
Upper ATR Line: Positioned above the previous candle’s close by 2x the ATR value.
Lower ATR Line: Positioned below the previous candle’s close by 2x the ATR value.
Key Features:
Customizable ATR Length: Allows users to input their preferred ATR period to suit different market conditions.
Dynamic Horizontal Lines: The lines update with each new candle, giving traders a clear visual of volatility levels.
Extended Right Lines: The horizontal rays extend to the right, serving as potential zones for price reversals or breakouts.
This indicator is useful for traders looking to gauge market volatility and set target levels or stops based on historical price movements.
How to Use:
Add the indicator to your chart and adjust the ATR length in the settings.
Watch how the price interacts with the upper and lower ATR lines as potential zones for support, resistance, or trend continuation.
Happy trading!
Mã nguồn mở
Theo đúng tinh thần TradingView, tác giả của tập lệnh này đã công bố nó dưới dạng mã nguồn mở, để các nhà giao dịch có thể xem xét và xác minh chức năng. Chúc mừng tác giả! Mặc dù bạn có thể sử dụng miễn phí, hãy nhớ rằng việc công bố lại mã phải tuân theo Nội quy.
Thông báo miễn trừ trách nhiệm
Thông tin và các ấn phẩm này không nhằm mục đích, và không cấu thành, lời khuyên hoặc khuyến nghị về tài chính, đầu tư, giao dịch hay các loại khác do TradingView cung cấp hoặc xác nhận. Đọc thêm tại Điều khoản Sử dụng.