OPEN-SOURCE SCRIPT
Cập nhật trendline function - JD
!EXPERIMENTAL!
As TV doesn't provide a function to draw lines between points, I wrote a function to do this in one my own indicators.
The function itself however can be applied/modified for different use cases, eg. drawing trendlines.
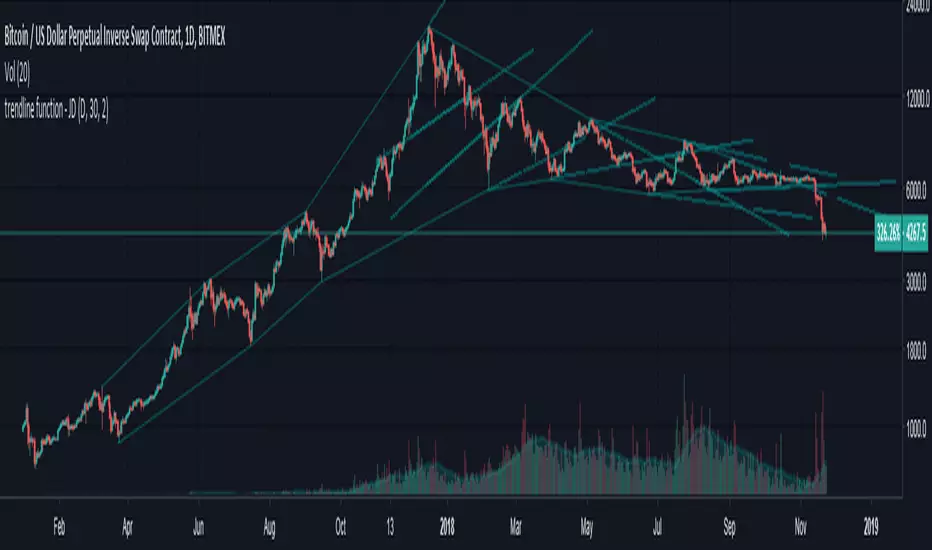
In this (proof of concept) example I used it to draw lines based on past high/low pivot points.
The inputs required:
* an INPUT FUNCTION (in this form, its designed to work with functions that have occasional values and na-values between them, it then connects the non-zero values to form a line)
* a BOOL (to indicate if you want to draw only the rising or falling lines)
* a DELAY (in this case this is the lookback period for the pivot-points function, this is to compensate the calculation of the past and realtime points)
The function returns:
* the function to draw the extension from the BASE-LINE to the current time (here this is the connection of the last pivot-point to the current point to bridge the gap of the lookback period, this is NOT REALTIME!)
* the function to draw the extension for the current time (here this is the continuation of the line until a new pivot-point is valid, this is DRAWN IN REALTIME!!)
* the color of the lines (in this case the lines are only colored (lime or fuchsia) if they either go up or down, else they are invisible, this is to clean up the invalid lines)
these output functions can then simply be plotted using the 'plot' function.
JD.
As TV doesn't provide a function to draw lines between points, I wrote a function to do this in one my own indicators.
The function itself however can be applied/modified for different use cases, eg. drawing trendlines.
In this (proof of concept) example I used it to draw lines based on past high/low pivot points.
The inputs required:
* an INPUT FUNCTION (in this form, its designed to work with functions that have occasional values and na-values between them, it then connects the non-zero values to form a line)
* a BOOL (to indicate if you want to draw only the rising or falling lines)
* a DELAY (in this case this is the lookback period for the pivot-points function, this is to compensate the calculation of the past and realtime points)
The function returns:
* the function to draw the extension from the BASE-LINE to the current time (here this is the connection of the last pivot-point to the current point to bridge the gap of the lookback period, this is NOT REALTIME!)
* the function to draw the extension for the current time (here this is the continuation of the line until a new pivot-point is valid, this is DRAWN IN REALTIME!!)
* the color of the lines (in this case the lines are only colored (lime or fuchsia) if they either go up or down, else they are invisible, this is to clean up the invalid lines)
these output functions can then simply be plotted using the 'plot' function.
JD.
Phát hành các Ghi chú
* Added MTF option* Added choice between colored or monochrome lines
* Added option to show only falling lines for "highs"-trendlines and rising lines for "lows"-trendlines or show all calculated lines
* Added switch between REGULAR and LOGARITHMIC SCALE trendlines !
Any suggestion? Feel free to share!!
JD.
Phát hành các Ghi chú
fixed cluttered screenshotPhát hành các Ghi chú
* code clean-up* added option to extend the trendlines to the future (Beta: some gaps may appear,... still working on that ;-) ! )
JD.
Mã nguồn mở
Theo đúng tinh thần TradingView, tác giả của tập lệnh này đã công bố nó dưới dạng mã nguồn mở, để các nhà giao dịch có thể xem xét và xác minh chức năng. Chúc mừng tác giả! Mặc dù bạn có thể sử dụng miễn phí, hãy nhớ rằng việc công bố lại mã phải tuân theo Nội quy.
Disclaimer.
I AM NOT A FINANCIAL ADVISOR.
THESE IDEAS ARE NOT ADVICE AND ARE FOR EDUCATION PURPOSES ONLY.
ALWAYS DO YOUR OWN RESEARCH!
JD.
You can contact me for info/access in PM or on Telegram: @jduyck
PLS, DON'T ASK FOR ACCESS IN THE COMMENT SECTION!
I AM NOT A FINANCIAL ADVISOR.
THESE IDEAS ARE NOT ADVICE AND ARE FOR EDUCATION PURPOSES ONLY.
ALWAYS DO YOUR OWN RESEARCH!
JD.
You can contact me for info/access in PM or on Telegram: @jduyck
PLS, DON'T ASK FOR ACCESS IN THE COMMENT SECTION!
Thông báo miễn trừ trách nhiệm
Thông tin và các ấn phẩm này không nhằm mục đích, và không cấu thành, lời khuyên hoặc khuyến nghị về tài chính, đầu tư, giao dịch hay các loại khác do TradingView cung cấp hoặc xác nhận. Đọc thêm tại Điều khoản Sử dụng.
Mã nguồn mở
Theo đúng tinh thần TradingView, tác giả của tập lệnh này đã công bố nó dưới dạng mã nguồn mở, để các nhà giao dịch có thể xem xét và xác minh chức năng. Chúc mừng tác giả! Mặc dù bạn có thể sử dụng miễn phí, hãy nhớ rằng việc công bố lại mã phải tuân theo Nội quy.
Thông báo miễn trừ trách nhiệm
Thông tin và các ấn phẩm này không nhằm mục đích, và không cấu thành, lời khuyên hoặc khuyến nghị về tài chính, đầu tư, giao dịch hay các loại khác do TradingView cung cấp hoặc xác nhận. Đọc thêm tại Điều khoản Sử dụng.