OPEN-SOURCE SCRIPT
Cập nhật Keltner Fibzones
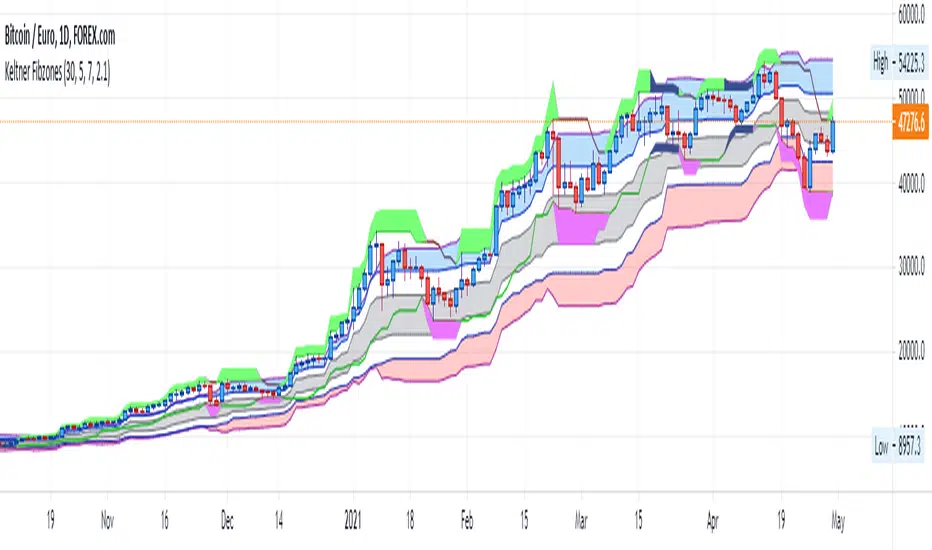
Keltner Channel with Fibonacci Zones which uses properties of a Donchian Channel.
This script is a variation of the Fibonacci Zone script and the Donchian Fibonacci Trading Tool which I published earlier. A Keltner Channel gives more useful information to the trader than a Donchian Channel, because it provides a depiction of “normal range” and shows “outside normalcy” situations. Fibonacci lines provide a way to see if the market is trending up or down, while moving inside the channel, because in cases where the Fibonacci lines function as resistance, the trend is down, whereas when these turn out to be supports the trend is up.
Example of use:
If after a rally up - in which candles moves outside the channel - these return into the channel, this means a “new normal”. If the fibs turn out to give support, one may assume that this is a temporary sideways movement in which a flag is formed, after which following rally up may happen. With rally down the opposite is true. Top and bottom situations show a change in the way the market uses the fiblines.
The middle line of the Donchian Channel is used as the middle line of the Keltner channel, in stead of the sma in the classic channel. Default for calculation is 2 x Average True Range above and below this line. Default for the periods of the channel is 20 periods, because this allows the candles to go outside the channel. If you shorten this, all happens inside the channel.
Phát hành các Ghi chú
Update In the inputs the periods are set to a default of 30, a minimum of 5 and a step of 5, because in practice that works quicker. (I use 30 periods for intraday charts and 20 periods for day and week charts). The width of the channel is set to a defoult of 5, a minimum of 2 and a step of 1, because I use 5 periods on my own charts. I changed the calculation of the Keltner lines (i.e. borders of the channel) so that these have a distance to the high or low fib, as the case may be, of at least one thenth ATR. Thus the width of the blue and red band becomes an indication of momentum (sort of). I changed the color of the low fib line to green, because this fits better to the color patters in the other lines. (btw you can change all colors in the style settings)Phát hành các Ghi chú
UpdateAdded Fat Side Path to the Keltner Fibzones. Default setting is off, if you want to see it, you need to switch in on in the inputs.
Use of this feature:
The Fat Side Path is published as a separate indicator here:

Together with the Keltner Fibzones I use it in the intraday charts to contemplate on the short price movements. In the day and weekly charts, which I use for stock picking, I switch it off, because if you flip through fifty or sixty charts you want them simple and clear.
In day trading it might give some help. Full discosure: I tried daytrading, done that, been there, lost a lot of money, wasted a lot of time.
If The Fibzones give more resistance than support, the dominant direction is down, i.e. the upticks are shorter and smaller than the downticks. You can go short if the path widens and when you notice leave high border or hit low border. Exit the position if the path narrows, or you notice leave low border or hit high border.
If the Fibzones give more support than resistance, the dominant direction is up. Then your go long when the path widens and you notice leave low border or hit high border, exit the position if the path narrows or you notice leave high border or hit low border.
Mã nguồn mở
Theo đúng tinh thần TradingView, tác giả của tập lệnh này đã công bố nó dưới dạng mã nguồn mở, để các nhà giao dịch có thể xem xét và xác minh chức năng. Chúc mừng tác giả! Mặc dù bạn có thể sử dụng miễn phí, hãy nhớ rằng việc công bố lại mã phải tuân theo Nội quy.
Thông báo miễn trừ trách nhiệm
Thông tin và các ấn phẩm này không nhằm mục đích, và không cấu thành, lời khuyên hoặc khuyến nghị về tài chính, đầu tư, giao dịch hay các loại khác do TradingView cung cấp hoặc xác nhận. Đọc thêm tại Điều khoản Sử dụng.