OPEN-SOURCE SCRIPT
5-8-13 + AVWAP + Fibonacci FULL Sistem (Temiz & Profesyonel)
✅ What This Indicator Is Doing (Full Explanation in English)
Your custom system combines several powerful components:
EMA 5-8-13,
AVWAP,
Auto Fibonacci,
Triple-Confirmation Buy/Sell Signals,
Background Trend Coloring.
Below is the complete breakdown.
🟩 1. Trend Detection with EMA 5-8-13
The indicator colors the background based on the alignment of:
EMA 5
EMA 8
EMA 13
Trend logic:
Uptrend (Green background):
EMA5 > EMA8 > EMA13
Downtrend (Red background):
EMA5 < EMA8 < EMA13
Caution Zone (Brown/Orange):
EMA5 < EMA8 but EMA8 > EMA13
→ Trend weakening, prepare for reversal.
🟩 2. Classic Buy/Sell Signals (EMA Cross)
These labels are the small “AL” and “SAT” signals.
BUY: EMA 5 crosses above EMA 13
SELL: EMA 5 crosses below EMA 13
This captures basic trend reversals.
🟩 3. AVWAP Dip/Peak Detection
The indicator automatically finds significant swing points:
AVWAP DIP (Green small label)
AVWAP PEAK (Red small label)
It then launches a new AVWAP line starting from that pivot.
So the yellow line is always the current Anchored VWAP starting from the most recent important DIP or PEAK.
🟩 4. Auto Fibonacci Levels (Clean Version)
The indicator calculates Fibonacci levels based on the last N bars (120 by default):
0.0
0.236
0.382
0.500
0.618
0.786
1.0
You now use the clean version, meaning:
✔ Only one set of Fibonacci lines appears
✔ No overlapping lines
✔ No chart clutter
✔ Always readable and minimal
🟩 5. Triple-Confirmation Buy/Sell Signals (Strong Signals)
These are the more important green/red labels (“🔥 AL” / “⚠️ SAT”).
A TRIPLE BUY (AL) happens when:
Price breaks above AVWAP
EMA 5-8-13 are aligned upward (trendUp)
Price is above Fibonacci 0.382
A TRIPLE SELL (SAT) happens when:
Price breaks below AVWAP
EMA 5-8-13 aligned downward (trendDown)
Price is below Fibonacci 0.382
This removes weak signals and gives high-quality entries and exits.
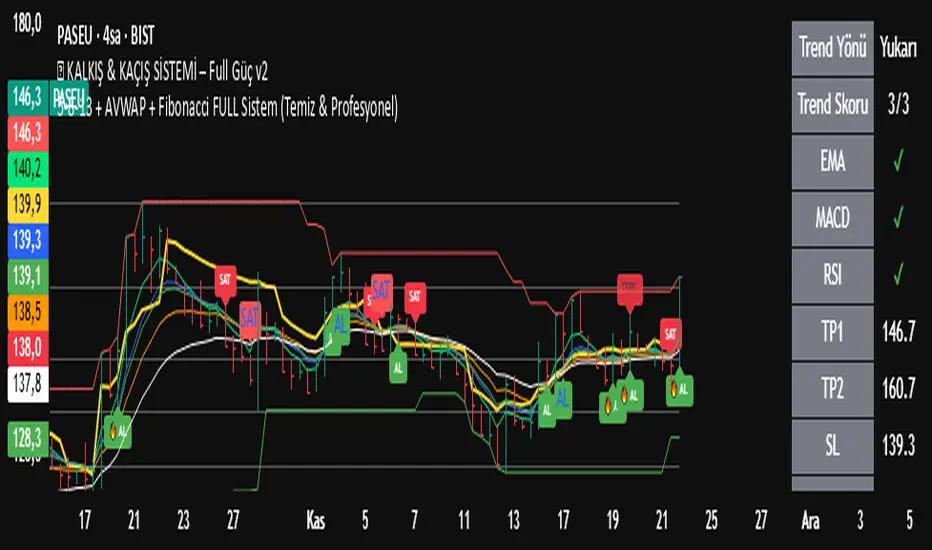
🟩 Summary of What You Saw on the Chart
Trend shifted to caution zone
Then EMA trend fully turned bearish
Price broke below AVWAP
Price dropped below Fibonacci 0.382
Triple Confirmation Sell appeared
Downtrend continued strongly afterward
Your indicator correctly identified:
👉 Trend weakening
👉 Bearish reversal
👉 Strong Sell zone
👉 Final drop
Your custom system combines several powerful components:
EMA 5-8-13,
AVWAP,
Auto Fibonacci,
Triple-Confirmation Buy/Sell Signals,
Background Trend Coloring.
Below is the complete breakdown.
🟩 1. Trend Detection with EMA 5-8-13
The indicator colors the background based on the alignment of:
EMA 5
EMA 8
EMA 13
Trend logic:
Uptrend (Green background):
EMA5 > EMA8 > EMA13
Downtrend (Red background):
EMA5 < EMA8 < EMA13
Caution Zone (Brown/Orange):
EMA5 < EMA8 but EMA8 > EMA13
→ Trend weakening, prepare for reversal.
🟩 2. Classic Buy/Sell Signals (EMA Cross)
These labels are the small “AL” and “SAT” signals.
BUY: EMA 5 crosses above EMA 13
SELL: EMA 5 crosses below EMA 13
This captures basic trend reversals.
🟩 3. AVWAP Dip/Peak Detection
The indicator automatically finds significant swing points:
AVWAP DIP (Green small label)
AVWAP PEAK (Red small label)
It then launches a new AVWAP line starting from that pivot.
So the yellow line is always the current Anchored VWAP starting from the most recent important DIP or PEAK.
🟩 4. Auto Fibonacci Levels (Clean Version)
The indicator calculates Fibonacci levels based on the last N bars (120 by default):
0.0
0.236
0.382
0.500
0.618
0.786
1.0
You now use the clean version, meaning:
✔ Only one set of Fibonacci lines appears
✔ No overlapping lines
✔ No chart clutter
✔ Always readable and minimal
🟩 5. Triple-Confirmation Buy/Sell Signals (Strong Signals)
These are the more important green/red labels (“🔥 AL” / “⚠️ SAT”).
A TRIPLE BUY (AL) happens when:
Price breaks above AVWAP
EMA 5-8-13 are aligned upward (trendUp)
Price is above Fibonacci 0.382
A TRIPLE SELL (SAT) happens when:
Price breaks below AVWAP
EMA 5-8-13 aligned downward (trendDown)
Price is below Fibonacci 0.382
This removes weak signals and gives high-quality entries and exits.
🟩 Summary of What You Saw on the Chart
Trend shifted to caution zone
Then EMA trend fully turned bearish
Price broke below AVWAP
Price dropped below Fibonacci 0.382
Triple Confirmation Sell appeared
Downtrend continued strongly afterward
Your indicator correctly identified:
👉 Trend weakening
👉 Bearish reversal
👉 Strong Sell zone
👉 Final drop
Mã nguồn mở
Theo đúng tinh thần TradingView, tác giả của tập lệnh này đã công bố nó dưới dạng mã nguồn mở, để các nhà giao dịch có thể xem xét và xác minh chức năng. Chúc mừng tác giả! Mặc dù bạn có thể sử dụng miễn phí, hãy nhớ rằng việc công bố lại mã phải tuân theo Nội quy.
Telegram kanalımızdakı sinyaller ücretsizdir.
Thông báo miễn trừ trách nhiệm
Thông tin và các ấn phẩm này không nhằm mục đích, và không cấu thành, lời khuyên hoặc khuyến nghị về tài chính, đầu tư, giao dịch hay các loại khác do TradingView cung cấp hoặc xác nhận. Đọc thêm tại Điều khoản Sử dụng.