OPEN-SOURCE SCRIPT
Cập nhật Bitcoin Halving Cycle Profit
The Bitcoin Halving Cycle Profit indicator, developed by Kevin Svenson, unveils a consistent and predetermined profit-taking cycle triggered by each Bitcoin halving event. This indicator streamlines the analysis of halving occurrences, providing explicit signals for both profit-taking and Dollar-Cost Averaging strategies.
Following each Bitcoin halving event, a fixed number of weeks consistently mark the period of maximum profitability for profit-taking:
🔄 Halving Cycle Profit Timeline Explained:
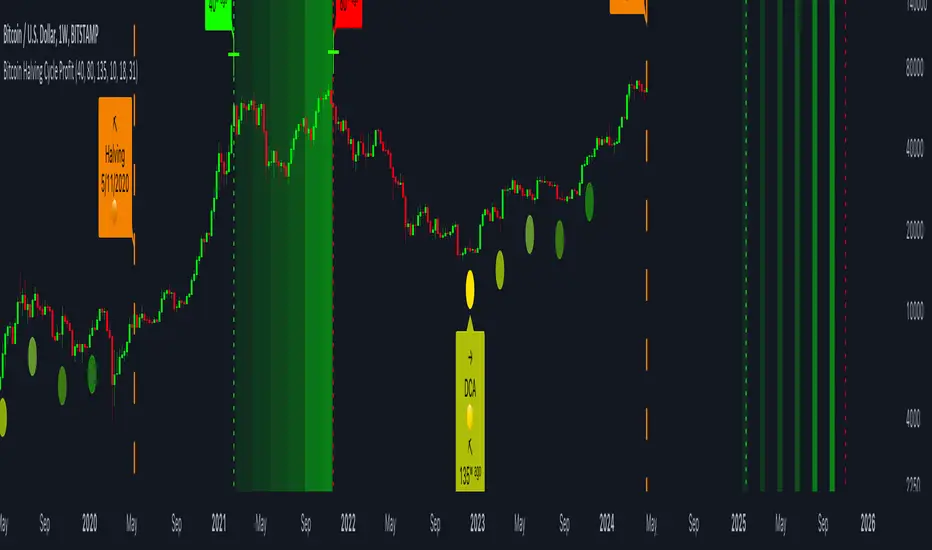
• 40 Weeks (Post-Halving) = Start of the optimal profit-taking zone.
• 80 Weeks (Post-Halving) = "Last Call" for profit-taking before the onset of a bear market.
• 125 Weeks (Post-Halving) = The optimal timeframe to begin Dollar-Cost Averaging.
(Bitcoin Weekly Chart using Halving Cycle Profit)

One standout feature of this indicator is its inherent clarity and comprehensive labeling. This quality makes it exceptionally easy to discern the locations of key factors and turning points, enhancing your understanding of the market dynamics it highlights.
(Bitcoin Daily Chart using Halving Cycle Profit)

🚀 This indicator doesn't limit its effectiveness to just Bitcoin; it seamlessly integrates with top blue-chip altcoins like Ethereum and most household names in the crypto industry.
(Ethereum Weekly Chart using Halving Cycle Profit)

🛠️ Customizable display options are availible. Users have the flexibility to toggle/adjust labels, lines, and color fills according to their preferences.
📑 In summary, the Bitcoin Halving Cycle Profit indicator is a versatile and user-friendly tool, offering clarity and customization for traders navigating both Bitcoin and top altcoins.
⚠️ It's important to note that while the Bitcoin Halving Cycle Profit indicator provides historical insights, past performance does not guarantee future results. Timing profitability in the cryptocurrency market involves inherent risks, and this indicator should not be construed as financial advice. Users are encouraged to exercise caution, conduct thorough research, and make informed decisions based on their individual risk tolerance and financial goals.
Following each Bitcoin halving event, a fixed number of weeks consistently mark the period of maximum profitability for profit-taking:
🔄 Halving Cycle Profit Timeline Explained:
• 40 Weeks (Post-Halving) = Start of the optimal profit-taking zone.
• 80 Weeks (Post-Halving) = "Last Call" for profit-taking before the onset of a bear market.
• 125 Weeks (Post-Halving) = The optimal timeframe to begin Dollar-Cost Averaging.
(Bitcoin Weekly Chart using Halving Cycle Profit)
One standout feature of this indicator is its inherent clarity and comprehensive labeling. This quality makes it exceptionally easy to discern the locations of key factors and turning points, enhancing your understanding of the market dynamics it highlights.
(Bitcoin Daily Chart using Halving Cycle Profit)
🚀 This indicator doesn't limit its effectiveness to just Bitcoin; it seamlessly integrates with top blue-chip altcoins like Ethereum and most household names in the crypto industry.
(Ethereum Weekly Chart using Halving Cycle Profit)
🛠️ Customizable display options are availible. Users have the flexibility to toggle/adjust labels, lines, and color fills according to their preferences.
📑 In summary, the Bitcoin Halving Cycle Profit indicator is a versatile and user-friendly tool, offering clarity and customization for traders navigating both Bitcoin and top altcoins.
⚠️ It's important to note that while the Bitcoin Halving Cycle Profit indicator provides historical insights, past performance does not guarantee future results. Timing profitability in the cryptocurrency market involves inherent risks, and this indicator should not be construed as financial advice. Users are encouraged to exercise caution, conduct thorough research, and make informed decisions based on their individual risk tolerance and financial goals.
Phát hành các Ghi chú
Last Update: Nov 2nd, 2023Primary Update Details:
- Added Monthly Chart Functionality
[Monthly Chart Functionality]
Secondary Update Details:
- Added extra DCA signals leading into each Halving event
- Adjusted the color bars to display cleaner/more evenly.
- The next Halving is set to plot on April 10th, 2024 in the script. I will update this when the Halving day is confirmed/known.
- Fixed source code description details. Nothing has changed about the dates or timing of Profit Start, End, and DCA.
[More DCA points moving into the halving]
Final Notes:
A popular request was to add monthly chart functionality, which was the main purpose of this update.
Phát hành các Ghi chú
Updated DescriptionPhát hành các Ghi chú
Indicator UpdateDue to limitations with future plotting on TradingView, the Bitcoin Halving Cycle Profit indicator will only support weekly and monthly charts until further notice. This change is to prevent issues caused by TradingView's 500-bar limitation.
What's Changed? Daily Chart Functionality Removed:
The indicator no longer supports daily chart plotting. This adjustment ensures the indicator stays within the 500-bar limitation for future plotting.
Weekly and Monthly Functionality:
You can continue to use the indicator on weekly and monthly charts, where the 40-week and 80-week post-halving profit zones are marked by green and red vertical lines.
What's Next?
Adding Future 40-Week Labels:
In upcoming updates, I plan to re-add the labels indicating future 40-week zones to the indicator. These labels will provide additional visual cues for profit-taking opportunities.
Re-adding Daily Chart Support:
When we're less than 500 days away from the start of the 40-week profit zone, I will re-introduce daily chart support. This will ensure the indicator works seamlessly without exceeding the 500-bar limitation.
Impact on Users
Weekly and Monthly Analysis:
Users can still track Bitcoin's halving cycle and identify profit-taking zones on weekly and monthly charts. The current indicator highlights the 40-week and 80-week post-halving zones with green and red vertical lines, respectively.
Future Enhancements:
Upcoming updates will focus on adding future 40-week labels to further enhance the indicator's usability. The re-introduction of daily chart support will occur closer to the 500-bar limitation.
I apologize for any inconvenience this change may cause, and thank you for your understanding as I work to improve the indicator's functionality within TradingView's constraints.
Mã nguồn mở
Theo đúng tinh thần TradingView, tác giả của tập lệnh này đã công bố nó dưới dạng mã nguồn mở, để các nhà giao dịch có thể xem xét và xác minh chức năng. Chúc mừng tác giả! Mặc dù bạn có thể sử dụng miễn phí, hãy nhớ rằng việc công bố lại mã phải tuân theo Nội quy.
Thông báo miễn trừ trách nhiệm
Thông tin và các ấn phẩm này không nhằm mục đích, và không cấu thành, lời khuyên hoặc khuyến nghị về tài chính, đầu tư, giao dịch hay các loại khác do TradingView cung cấp hoặc xác nhận. Đọc thêm tại Điều khoản Sử dụng.