OPEN-SOURCE SCRIPT
ATR with Donchian Channels and SMAs
This script combines the Average True Range (ATR), Donchian Channels, and Simple Moving Averages (SMAs) to provide a comprehensive tool for volatility and trend analysis.
Key Components:
ATR Calculation: The ATR is used to measure market volatility. It is calculated as a moving average of the true range over a specified length, which you can customize using different smoothing methods: RMA, SMA, EMA, or WMA. ATR helps identify periods of high and low volatility, giving insights into potential breakout or consolidation phases in the market.
Donchian Channels on ATR: The Donchian Channels are calculated based on the highest and lowest values of the ATR over a user-defined period. The upper and lower bands provide a volatility range, and the middle line represents the average of the two. This can help visualize the range of market volatility and detect possible trend reversals or continuations.
SMAs on ATR: Two Simple Moving Averages (SMA) are applied to the ATR values. These SMAs act as a smoothed version of the ATR, providing additional insight into volatility trends. By adjusting the length of these SMAs, you can track short-term and long-term volatility movements, helping in decision-making for potential entries and exits.
Inputs:
ATR Length: Set the length for calculating the ATR.
Smoothing Method: Choose from RMA, SMA, EMA, or WMA for smoothing the ATR calculation.
Donchian Channel Length: Set the length for calculating the highest and lowest ATR values for Donchian Channels.
SMA Lengths: Two adjustable lengths for applying SMAs to the ATR.
Visualization:
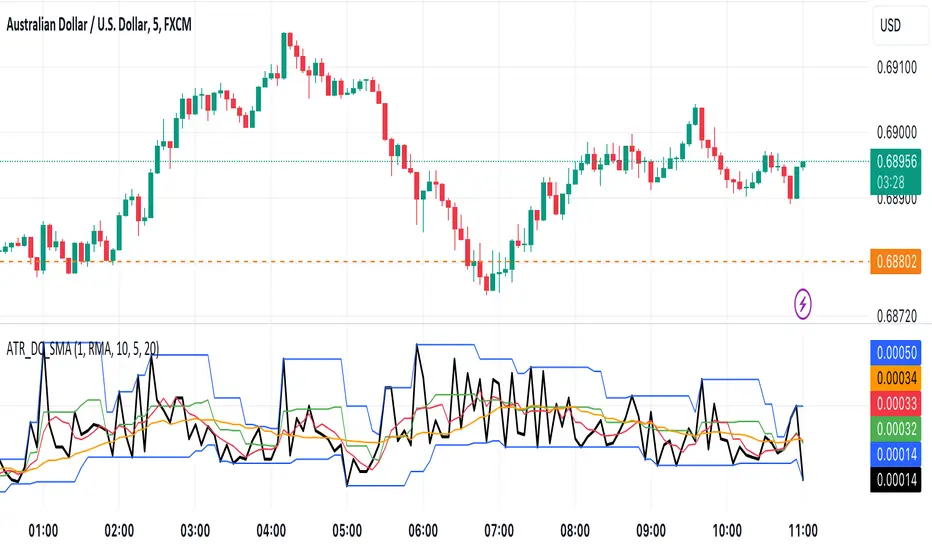
ATR Plot: The ATR is plotted in red, allowing you to see the market's volatility at a glance.
Donchian Channels: Blue lines represent the upper and lower bands, while the green line represents the middle line of the Donchian Channels, helping you visualize the volatility range.
SMAs: Two SMAs (green and orange) are plotted to smooth out the ATR and identify trends in volatility.
Use Cases:
Breakout Detection: High ATR values breaking out of the Donchian Channels may signal increased volatility and a potential breakout.
Trend Analysis: SMAs on ATR help smooth volatility trends, aiding in determining if the market is entering a more volatile or stable period.
Stop-Loss Placement: ATR and Donchian Channels can be used to set dynamic stop-loss levels based on market volatility.
This script is versatile and can be used across different asset classes, such as stocks, forex, crypto, and commodities. It is especially useful for traders who want to incorporate volatility into their trading strategies for better risk management and trend detection.
Key Components:
ATR Calculation: The ATR is used to measure market volatility. It is calculated as a moving average of the true range over a specified length, which you can customize using different smoothing methods: RMA, SMA, EMA, or WMA. ATR helps identify periods of high and low volatility, giving insights into potential breakout or consolidation phases in the market.
Donchian Channels on ATR: The Donchian Channels are calculated based on the highest and lowest values of the ATR over a user-defined period. The upper and lower bands provide a volatility range, and the middle line represents the average of the two. This can help visualize the range of market volatility and detect possible trend reversals or continuations.
SMAs on ATR: Two Simple Moving Averages (SMA) are applied to the ATR values. These SMAs act as a smoothed version of the ATR, providing additional insight into volatility trends. By adjusting the length of these SMAs, you can track short-term and long-term volatility movements, helping in decision-making for potential entries and exits.
Inputs:
ATR Length: Set the length for calculating the ATR.
Smoothing Method: Choose from RMA, SMA, EMA, or WMA for smoothing the ATR calculation.
Donchian Channel Length: Set the length for calculating the highest and lowest ATR values for Donchian Channels.
SMA Lengths: Two adjustable lengths for applying SMAs to the ATR.
Visualization:
ATR Plot: The ATR is plotted in red, allowing you to see the market's volatility at a glance.
Donchian Channels: Blue lines represent the upper and lower bands, while the green line represents the middle line of the Donchian Channels, helping you visualize the volatility range.
SMAs: Two SMAs (green and orange) are plotted to smooth out the ATR and identify trends in volatility.
Use Cases:
Breakout Detection: High ATR values breaking out of the Donchian Channels may signal increased volatility and a potential breakout.
Trend Analysis: SMAs on ATR help smooth volatility trends, aiding in determining if the market is entering a more volatile or stable period.
Stop-Loss Placement: ATR and Donchian Channels can be used to set dynamic stop-loss levels based on market volatility.
This script is versatile and can be used across different asset classes, such as stocks, forex, crypto, and commodities. It is especially useful for traders who want to incorporate volatility into their trading strategies for better risk management and trend detection.
Mã nguồn mở
Theo đúng tinh thần TradingView, tác giả của tập lệnh này đã công bố nó dưới dạng mã nguồn mở, để các nhà giao dịch có thể xem xét và xác minh chức năng. Chúc mừng tác giả! Mặc dù bạn có thể sử dụng miễn phí, hãy nhớ rằng việc công bố lại mã phải tuân theo Nội quy.
Thông báo miễn trừ trách nhiệm
Thông tin và các ấn phẩm này không nhằm mục đích, và không cấu thành, lời khuyên hoặc khuyến nghị về tài chính, đầu tư, giao dịch hay các loại khác do TradingView cung cấp hoặc xác nhận. Đọc thêm tại Điều khoản Sử dụng.