OPEN-SOURCE SCRIPT
Ninja Trend v2
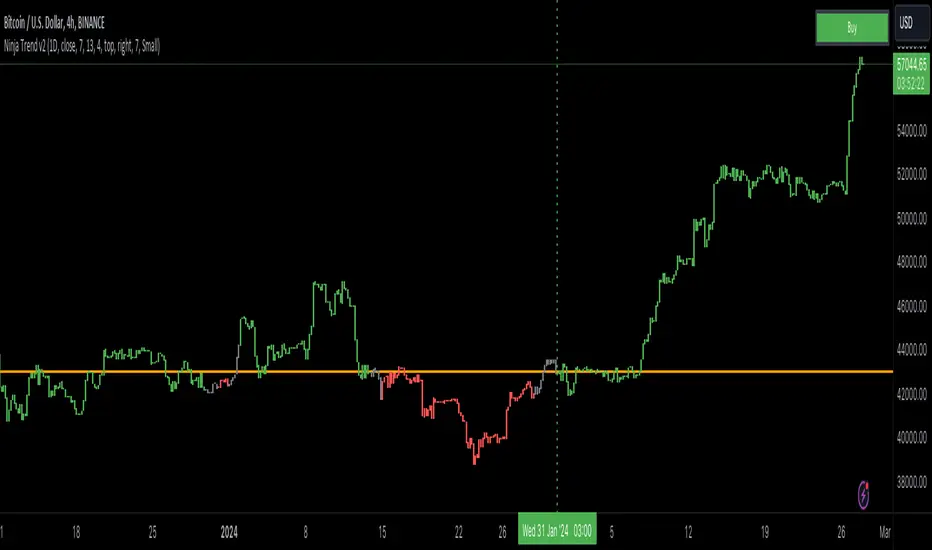
Ninja Trend V2 is best for swing, day trading and scalping using higher timeframe bias and executing in the lower timeframes. Uses MACD for the overall bias and paints a Heikin-Ashi chart.
Settings:
Firstly, go to chart settings, check (tick) the body, uncheck borders and wicks.
Secondly, go to the script settings and input the following;
Source close
Fast moving average 7
Slow moving average 13
Signal length 4
For day trading and scalping, change the script settings timeframe to 15 minutes and use a smaller chart timeframe (M5 or M1)
For swinging change the script settings timeframe to Daily and use H4 chart timeframe.
Behind the code:
When the higher timeframe MACD histogram crosses and closes above zero line, script goes to neutral and paints grey bars waiting for the signal line to cross and close above the zero line and then paints green bars and a buy signal is generated.
When the higher timeframe MACD histogram crosses and closes below zero line, script goes to neutral and paints grey bars waiting for the signal line to cross and close below the zero line and then paints red bars.
Advantage of this is to filter out the chart noise by painting Heikin Ashi charts.
Signals:
Grey means neutral. No entries should be made.
Red means sells only. And then hold until the trend changes to green or use your desired TP and SL.
Green means buys only. And then hold until the trend changes to red or use your desired TP and SL.
Mã nguồn mở
Theo đúng tinh thần TradingView, tác giả của tập lệnh này đã công bố nó dưới dạng mã nguồn mở, để các nhà giao dịch có thể xem xét và xác minh chức năng. Chúc mừng tác giả! Mặc dù bạn có thể sử dụng miễn phí, hãy nhớ rằng việc công bố lại mã phải tuân theo Nội quy.
Thông báo miễn trừ trách nhiệm
Thông tin và các ấn phẩm này không nhằm mục đích, và không cấu thành, lời khuyên hoặc khuyến nghị về tài chính, đầu tư, giao dịch hay các loại khác do TradingView cung cấp hoặc xác nhận. Đọc thêm tại Điều khoản Sử dụng.