OPEN-SOURCE SCRIPT
Cập nhật Average Range Targets
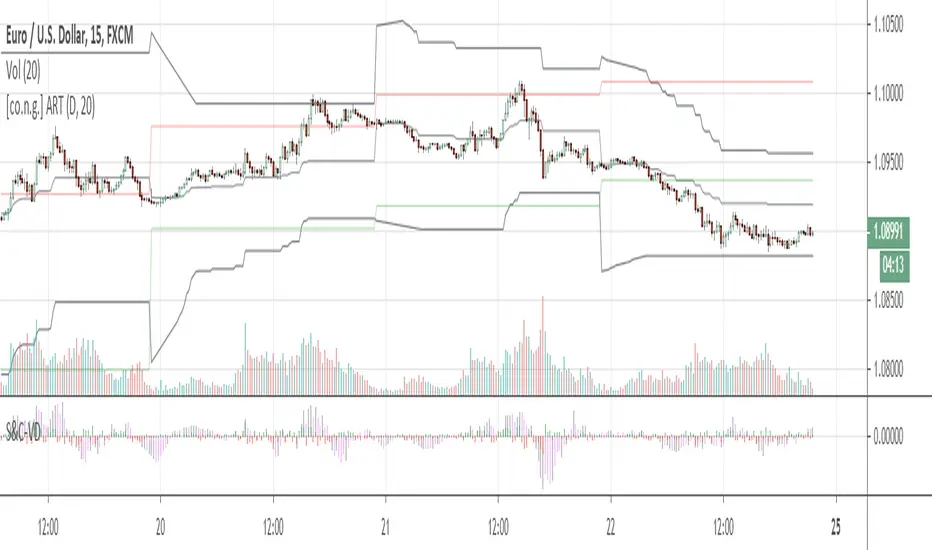
This super simple script helps spotting possible turnarounds and targets on intraday level.
The average daily range is calculated over a period of 20 days, which is approximately a trading month.
The black lines indicate the upper and lower range targets, moving closer with each new intrady high and low.
As you might recognize, in most cases the price is about to turn when one range target is hit.
The red and green lines are showing previous day's high and low as referneces.
Enjoy!
Warm regards,
Constantine Trading
Phát hành các Ghi chú
Slimmed the script and sped up calculations, fixed plotting errors.1st:
I've added a midrange level. Usually, if price is below midrange, action is suppoes to be short;
if price is above otherwise.
2nd:
Most of the time price bounces once from range target level. If it reaches a second time, chances of breaking through are high.
HINT!
Don't rely solely on this script always watch out for a proper price action setup! Consider trend direction!
Mã nguồn mở
Theo đúng tinh thần TradingView, tác giả của tập lệnh này đã công bố nó dưới dạng mã nguồn mở, để các nhà giao dịch có thể xem xét và xác minh chức năng. Chúc mừng tác giả! Mặc dù bạn có thể sử dụng miễn phí, hãy nhớ rằng việc công bố lại mã phải tuân theo Nội quy.
Thông báo miễn trừ trách nhiệm
Thông tin và các ấn phẩm này không nhằm mục đích, và không cấu thành, lời khuyên hoặc khuyến nghị về tài chính, đầu tư, giao dịch hay các loại khác do TradingView cung cấp hoặc xác nhận. Đọc thêm tại Điều khoản Sử dụng.