OPEN-SOURCE SCRIPT
Cập nhật True Balance of power
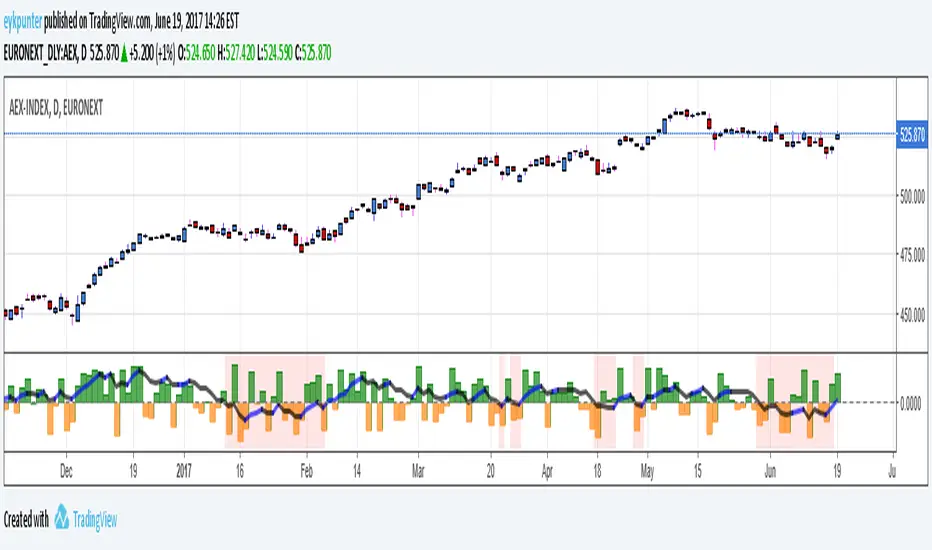
This is an improvement of the script published by LazyBear, 
The improvements are:
1. it includes gaps because it uses true range in stead of the current bar,
2. it has been turned into a percent oscillator as the basic algorithm belongs in the family of stochastic oscillators.
Unlike the usual stochatics I refrained from over the top averaging and smoothing, nor did I attempt a signal line. There’s no need to make a mock MACD.
The indicator should be interpreted as a stochastics, the difference between Stochs and MACD is that stochs report inclinations, i.e. in which direction the market is edging, while MACD reports movements, in which direction the market is moving. Stochs are an early indicator, MACD is lagging. The emoline is a 30 period linear regression, I use linear regressions because these have no lagging, react immidiately to changes, I use a 30 period version because that is not so nervous. You might say that an MA gives an average while a linear regression gives an ‘over all’ of the periods.
The back ground color is red when the emoline is below zero, that is where the market ‘looks down’, white where the market ‘looks up’. This doesn’t mean that the market will actually go down or up, it may allways change its mind.
Have fun and take care, Eykpunter.
Phát hành các Ghi chú
I fixed the fault that changing the periods in the inputs had no effect. Now it has.Phát hành các Ghi chú
Added comments in the script and changed the names of some variables in more suggestive mnemonics.Mã nguồn mở
Theo đúng tinh thần TradingView, tác giả của tập lệnh này đã công bố nó dưới dạng mã nguồn mở, để các nhà giao dịch có thể xem xét và xác minh chức năng. Chúc mừng tác giả! Mặc dù bạn có thể sử dụng miễn phí, hãy nhớ rằng việc công bố lại mã phải tuân theo Nội quy.
Thông báo miễn trừ trách nhiệm
Thông tin và các ấn phẩm này không nhằm mục đích, và không cấu thành, lời khuyên hoặc khuyến nghị về tài chính, đầu tư, giao dịch hay các loại khác do TradingView cung cấp hoặc xác nhận. Đọc thêm tại Điều khoản Sử dụng.
Mã nguồn mở
Theo đúng tinh thần TradingView, tác giả của tập lệnh này đã công bố nó dưới dạng mã nguồn mở, để các nhà giao dịch có thể xem xét và xác minh chức năng. Chúc mừng tác giả! Mặc dù bạn có thể sử dụng miễn phí, hãy nhớ rằng việc công bố lại mã phải tuân theo Nội quy.
Thông báo miễn trừ trách nhiệm
Thông tin và các ấn phẩm này không nhằm mục đích, và không cấu thành, lời khuyên hoặc khuyến nghị về tài chính, đầu tư, giao dịch hay các loại khác do TradingView cung cấp hoặc xác nhận. Đọc thêm tại Điều khoản Sử dụng.