OPEN-SOURCE SCRIPT
Cập nhật Bullseye PDHL
Bullseye PDHL Indicator
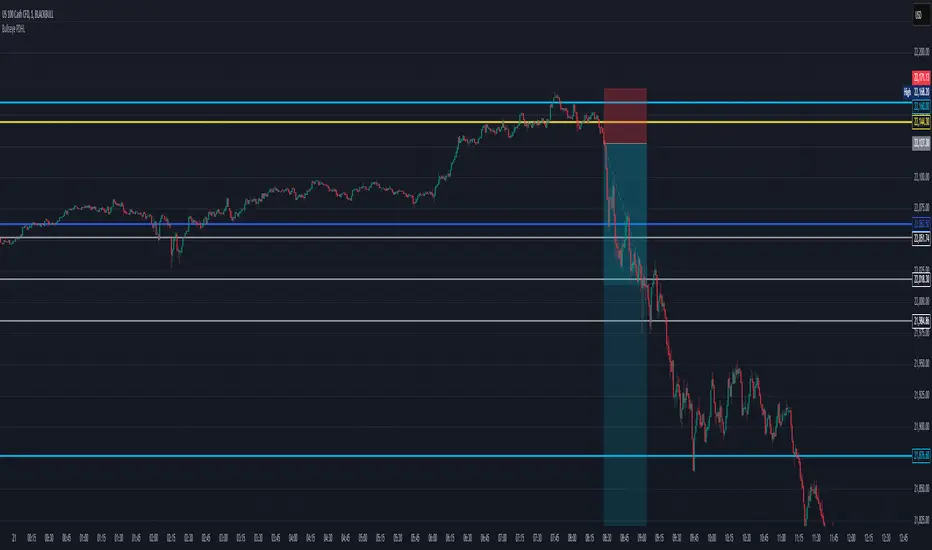
The Bullseye PDHL indicator is designed for traders who want to visually identify key price levels from the previous trading day, including the high, low, and significant Fibonacci retracement levels. This indicator helps traders understand potential support and resistance zones, which can be useful for planning entries and exits.
Key Features:
Previous Day’s High and Low:
Plots the previous day’s high and low as solid lines on the chart to easily identify important levels from the prior session.
These levels serve as critical support and resistance markers, which are often respected by the market.
Fibonacci Retracement Levels:
Plots three Fibonacci retracement levels (38.2%, 50%, and 61.8%) between the previous day’s high and low.
These levels are key reference points for assessing potential pullbacks or retracements during the current trading day.
Visual Representation:
The previous day’s high and low are plotted in cyan for easy differentiation.
The Fibonacci retracement levels (30%, 50%, 60%) are plotted in white, providing a clear visual reference for traders.
This indicator can help traders identify important reaction zones and areas where price might reverse or consolidate, making it a valuable addition for technical analysis.
Phát hành các Ghi chú
Cool Update to Bullseye PDHL on TradingView!Hey traders! 🚀 Check out the latest tweak to the Bullseye PDHL indicator—it's now got neat switches to show or hide yesterday's open and close prices right on your charts. Customize your view, keep your charts slick, and make analyzing those price moves easier than ever! Jump into your next trade with style with the new Bullseye PDHL!
Mã nguồn mở
Theo đúng tinh thần TradingView, tác giả của tập lệnh này đã công bố nó dưới dạng mã nguồn mở, để các nhà giao dịch có thể xem xét và xác minh chức năng. Chúc mừng tác giả! Mặc dù bạn có thể sử dụng miễn phí, hãy nhớ rằng việc công bố lại mã phải tuân theo Nội Quy.
Thông báo miễn trừ trách nhiệm
Thông tin và các ấn phẩm này không nhằm mục đích, và không cấu thành, lời khuyên hoặc khuyến nghị về tài chính, đầu tư, giao dịch hay các loại khác do TradingView cung cấp hoặc xác nhận. Đọc thêm tại Điều khoản Sử dụng.