OPEN-SOURCE SCRIPT
Bias Dashboard + All Open Lines (M/W/D/H4/H1/15min)
What does the script do?
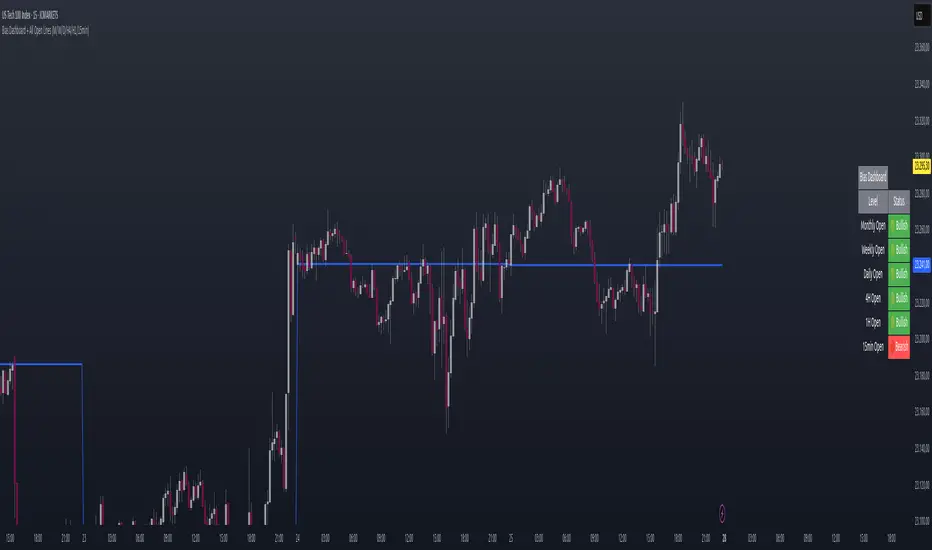
This script displays a dashboard that shows the current market bias relative to the open prices of multiple timeframes:
Monthly
Weekly
Daily
4H
1H
15min
Additionally, it plots horizontal lines at each of these open levels on the chart.
How it works
Fetch Open Prices:
The script uses request.security() to get the open prices for each timeframe.
Determine Bias:
Compares the current close price to each open:
If close > open, then "Bullish"
If close < open, then "Bearish"
Display Dashboard:
A visual dashboard shows:
The timeframe label
Whether the current price is above (bullish) or below (bearish) that level
Plot Lines:
Colored horizontal lines are drawn on the chart to indicate each timeframe’s open level.
Mã nguồn mở
Theo đúng tinh thần TradingView, tác giả của tập lệnh này đã công bố nó dưới dạng mã nguồn mở, để các nhà giao dịch có thể xem xét và xác minh chức năng. Chúc mừng tác giả! Mặc dù bạn có thể sử dụng miễn phí, hãy nhớ rằng việc công bố lại mã phải tuân theo Nội quy.
Thông báo miễn trừ trách nhiệm
Thông tin và các ấn phẩm này không nhằm mục đích, và không cấu thành, lời khuyên hoặc khuyến nghị về tài chính, đầu tư, giao dịch hay các loại khác do TradingView cung cấp hoặc xác nhận. Đọc thêm tại Điều khoản Sử dụng.