OPEN-SOURCE SCRIPT
Cập nhật US Yield Curve (2-10yr)
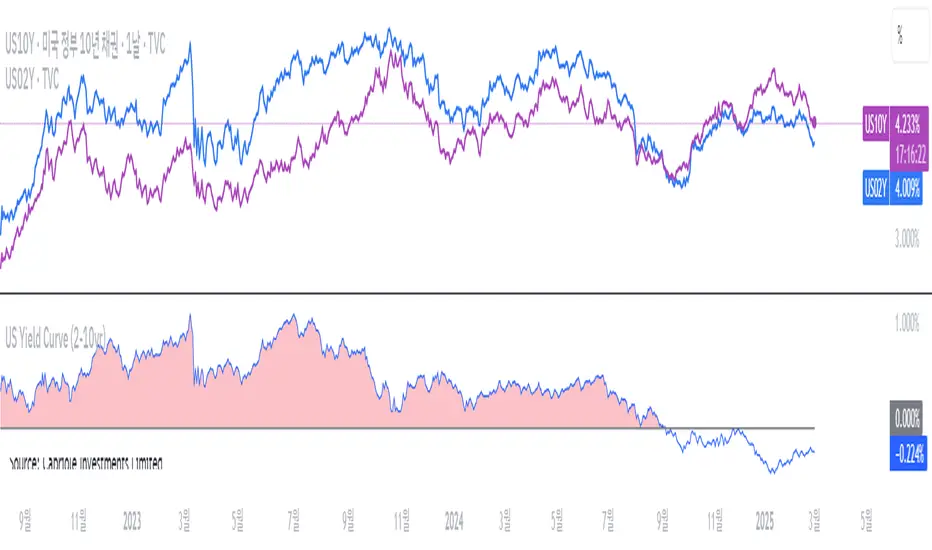
US Yield Curve (2-10yr) by oonoon
2-10Y US Yield Curve and Investment Strategies
The 2-10 year US Treasury yield spread measures the difference between the 10-year and 2-year Treasury yields. It is a key indicator of economic conditions.
Inversion (Spread < 0%): When the 2-year yield exceeds the 10-year yield, it signals a potential recession. Investors may shift to long-term bonds (TLT, ZROZ), gold (GLD), or defensive stocks.
Steepening (Spread widening): A rising 10-year yield relative to the 2-year suggests economic expansion. Investors can benefit by shorting bonds (TBT) or investing in financial stocks (XLF). The Amundi US Curve Steepening 2-10Y ETF can be used to profit from this trend.
Monitoring the curve: Traders can track US10Y-US02Y on TradingView for real-time insights and adjust portfolios accordingly.
Phát hành các Ghi chú
2-10Y US Yield Curve and Investment Strategies by oonoonThe 2-10 year US Treasury yield spread measures the difference between the 10-year and 2-year Treasury yields. It is a key indicator of economic conditions.
Inversion (Spread < 0%): When the 2-year yield exceeds the 10-year yield, it signals a potential recession. Investors may shift to long-term bonds (TLT, ZROZ), gold (GLD), or defensive stocks.
Steepening (Spread widening): A rising 10-year yield relative to the 2-year suggests economic expansion. Investors can benefit by shorting bonds (TBT) or investing in financial stocks (XLF). The Amundi US Curve Steepening 2-10Y ETF can be used to profit from this trend.
Monitoring the curve: Traders can track US10Y-US02Y on TradingView for real-time insights and adjust portfolios accordingly.
Mã nguồn mở
Theo đúng tinh thần TradingView, tác giả của tập lệnh này đã công bố nó dưới dạng mã nguồn mở, để các nhà giao dịch có thể xem xét và xác minh chức năng. Chúc mừng tác giả! Mặc dù bạn có thể sử dụng miễn phí, hãy nhớ rằng việc công bố lại mã phải tuân theo Nội quy.
Thông báo miễn trừ trách nhiệm
Thông tin và các ấn phẩm này không nhằm mục đích, và không cấu thành, lời khuyên hoặc khuyến nghị về tài chính, đầu tư, giao dịch hay các loại khác do TradingView cung cấp hoặc xác nhận. Đọc thêm tại Điều khoản Sử dụng.