OPEN-SOURCE SCRIPT
Easy RSI by nnam
What Does this Indicator Do?
The Easy RSI Indicator color codes candles based on their RSI Value vs. Open / Close (Red / Green). It plots the current price and current RSI value on the chart in real-time. Additionally, when the RSI Value is in an oversold or overbought condition, it plots that signal on the chart in real-time.
The initial candle color is the standard Red / Green Tradingview color, but a Gradient is added to the color which either darkens or lightens the color based on the RSI Value.
As seen in the screenshot below, the higher the RSI Value, the brighter the Green Color is. The lower the RSI Value, the brighter the Red Color is.
https://www.tradingview.com/x/Hvwf1IyV/
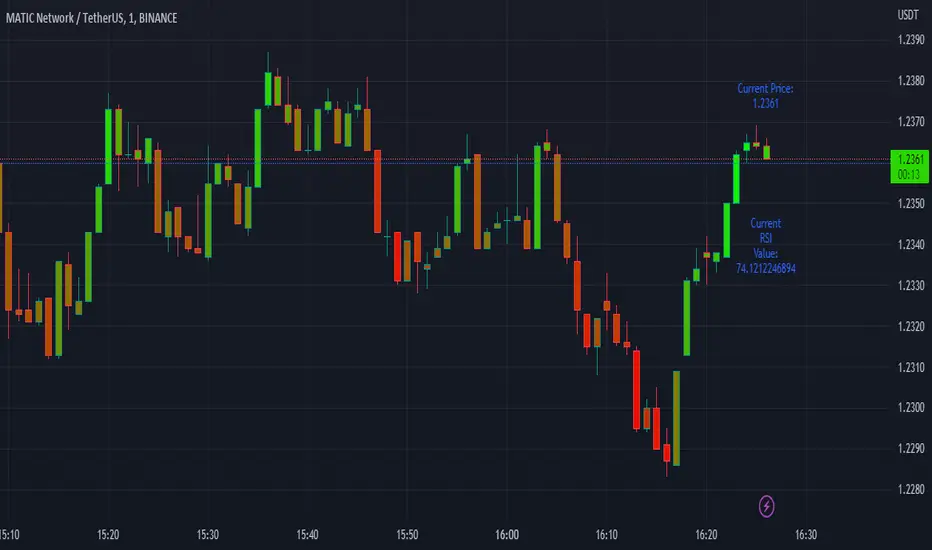
The current Price and current RSI Value are both plotted on the chart by default, but can be optionally switched off by the trader.
As seen in the screenshot below, the prices and RSI Values are easily seen while visually tracking the price in real-time.
https://www.tradingview.com/x/wOdPln5t/
RSI Overbought Values are plotted when the Overbought condition is triggered. The Default is RED for Overbought and GREEN for Oversold.
As seen in the screenshot below, with all three labels turned on under the input settings (these are ON by default) you can see the overbought condition, the current RSI Value, and current price all in one centralized area. Oversold Values are also plotted when turned on under the input settings.
https://www.tradingview.com/x/tHaUiW1b/
As shown in the screenshot below, the candle is GREEN (as evident by the green candle outline) but the RSI Value is low and shows lower than average relative strength. This turns the bar color ORANGE vs, GREEN showing that the relative strength of the move is subpar.
https://www.tradingview.com/x/D4FOLamI/
As shown on the screenshot below, if the trader has the standard Tradingview Price label switched on (in the Tradingview Chart Settings), the color of the bar is also translated to the price are for an easy to recognize RSI Value just by looking at the price. Even if the current candle is RED, when the RSI is higher than lower, the color will be green / greenish and even if the current candle is GREEN, when the RSI Value is lower than higher, the color will be red-ish / orange in color giving the user a quick view of RSI Value.
https://www.tradingview.com/x/Utnd0DVy/
If you have any questions or feature requests for this Indicator please do not hesitate to reach out and ask.
GOOD LUCK trading!!
~nnamdert
The Easy RSI Indicator color codes candles based on their RSI Value vs. Open / Close (Red / Green). It plots the current price and current RSI value on the chart in real-time. Additionally, when the RSI Value is in an oversold or overbought condition, it plots that signal on the chart in real-time.
The initial candle color is the standard Red / Green Tradingview color, but a Gradient is added to the color which either darkens or lightens the color based on the RSI Value.
As seen in the screenshot below, the higher the RSI Value, the brighter the Green Color is. The lower the RSI Value, the brighter the Red Color is.
https://www.tradingview.com/x/Hvwf1IyV/
The current Price and current RSI Value are both plotted on the chart by default, but can be optionally switched off by the trader.
As seen in the screenshot below, the prices and RSI Values are easily seen while visually tracking the price in real-time.
https://www.tradingview.com/x/wOdPln5t/
RSI Overbought Values are plotted when the Overbought condition is triggered. The Default is RED for Overbought and GREEN for Oversold.
As seen in the screenshot below, with all three labels turned on under the input settings (these are ON by default) you can see the overbought condition, the current RSI Value, and current price all in one centralized area. Oversold Values are also plotted when turned on under the input settings.
https://www.tradingview.com/x/tHaUiW1b/
As shown in the screenshot below, the candle is GREEN (as evident by the green candle outline) but the RSI Value is low and shows lower than average relative strength. This turns the bar color ORANGE vs, GREEN showing that the relative strength of the move is subpar.
https://www.tradingview.com/x/D4FOLamI/
As shown on the screenshot below, if the trader has the standard Tradingview Price label switched on (in the Tradingview Chart Settings), the color of the bar is also translated to the price are for an easy to recognize RSI Value just by looking at the price. Even if the current candle is RED, when the RSI is higher than lower, the color will be green / greenish and even if the current candle is GREEN, when the RSI Value is lower than higher, the color will be red-ish / orange in color giving the user a quick view of RSI Value.
https://www.tradingview.com/x/Utnd0DVy/
If you have any questions or feature requests for this Indicator please do not hesitate to reach out and ask.
GOOD LUCK trading!!
~nnamdert
Mã nguồn mở
Theo đúng tinh thần TradingView, tác giả của tập lệnh này đã công bố nó dưới dạng mã nguồn mở, để các nhà giao dịch có thể xem xét và xác minh chức năng. Chúc mừng tác giả! Mặc dù bạn có thể sử dụng miễn phí, hãy nhớ rằng việc công bố lại mã phải tuân theo Nội quy.
Join our DISCORD for more free private indicators or if you need TRAINING on our Indicators.
discord.com/invite/nZfY854MXR
Become a Patron
patreon.com/nnamdert
discord.com/invite/nZfY854MXR
Become a Patron
patreon.com/nnamdert
Thông báo miễn trừ trách nhiệm
Thông tin và các ấn phẩm này không nhằm mục đích, và không cấu thành, lời khuyên hoặc khuyến nghị về tài chính, đầu tư, giao dịch hay các loại khác do TradingView cung cấp hoặc xác nhận. Đọc thêm tại Điều khoản Sử dụng.