OPEN-SOURCE SCRIPT
Cập nhật Statistical Footprint
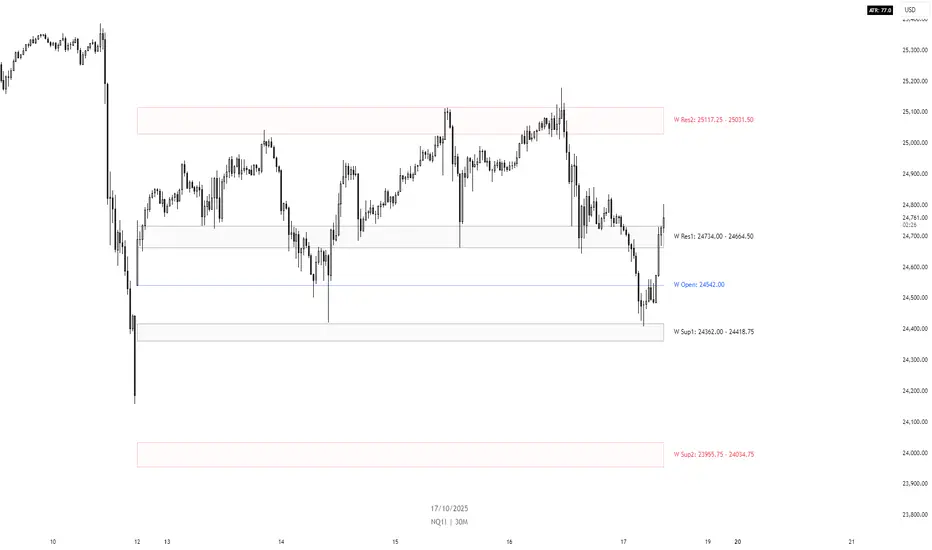
Statistical Footprint - Behavioral Support & Resistance
This indicator identifies key price levels based on actual market behavior rather than traditional pivot calculations. It analyzes how bulls and bears have historically moved price from session opens, creating statistical zones where future reactions are most likely.
The concept is simple: track how far bullish candles typically push above the open versus how far bearish candles drop below it. These patterns reveal the market's behavioral "footprint" - showing where momentum typically stalls and reverses.
Key Features:
- Separate analysis for daily and weekly timeframes
- Smart zone merging when levels cluster together (within 5 points)
- Uses both mean and median calculations for more robust levels
- XGBoost-optimized lookback periods for maximum statistical significance
- Clean zone-only display focused on actionable price areas
How it Works:
The code separates bullish and bearish sessions, measuring their typical range extensions from the open. It then projects these statistical ranges forward from current session opens, creating "behavioral zones" where the market has historically shown consistent reactions.
When daily and weekly levels align closely, they merge into combined zones with enhanced significance. Labels show both the mean and median values when they differ meaningfully.
Best Used For:
- Identifying high-probability reversal zones
- Setting profit targets based on historical behavior
- Understanding market sentiment shifts at key levels
- Confluence analysis between different timeframes
The lookback periods have been optimized using machine learning to find the most predictive historical sample sizes for current market conditions.
Phát hành các Ghi chú
Update: Updated the daily and weekly values to be more accurate.
Phát hành các Ghi chú
Updated the name to Fancy Zones.Phát hành các Ghi chú
Updated name.Phát hành các Ghi chú
Updated to version 3.0.This updates includes a few logic updates, visual updates, and cleanup.
Mã nguồn mở
Theo đúng tinh thần TradingView, tác giả của tập lệnh này đã công bố nó dưới dạng mã nguồn mở, để các nhà giao dịch có thể xem xét và xác minh chức năng. Chúc mừng tác giả! Mặc dù bạn có thể sử dụng miễn phí, hãy nhớ rằng việc công bố lại mã phải tuân theo Nội quy.
Thông báo miễn trừ trách nhiệm
Thông tin và các ấn phẩm này không nhằm mục đích, và không cấu thành, lời khuyên hoặc khuyến nghị về tài chính, đầu tư, giao dịch hay các loại khác do TradingView cung cấp hoặc xác nhận. Đọc thêm tại Điều khoản Sử dụng.