OPEN-SOURCE SCRIPT
Cập nhật Movement Polarization (MoP)
This shows the negative or positive charge of price movement and volume .
The "Polarization" shows how much negativity or positivity the movement of the price and volume have.
IMPORTANT:
Use with crypto currencies only is highly recommended.
If the volume in a currency is not visible, adjust the "Factor" number higher in the "Inputs" tab.
Adjust it until there is a balance between the vertical spread of the volume and polarization.
There will be a noticeable jump in the scale of the indicator if it is set too high.
The "Factor" is scaled at a baseline for SHIB prices. Any lower price scales than SHIB's will not show the volume .
Version:
This is a forked codebase to conserve the functionality of "RSI TV". The "RSI TV" focuses only on the RSI trend, this focuses on price and volume movement.
As such, there is no need for the MA of the RSI. Also, the TV Line from the "RSI TV" is used to show polarization of movement in this context.
The Trend Veracity line from the "RSI TV" has a broad scope in verifying different, particular trends, not just the RSI trend.
The RSI, volume, and polarization are all conveniently placed within the same scale to facilitate longer-term trading with price action. See also: "RSI TV".
How this indicator is original; what it does, and how it does it:
This indicator has an original, unique ability to give the volume a further-projecting forecast.
The MoP does this by placing the volume on a vertical scale. It then compares it to a polarization level.
This gives 3 reference points: 1) Past data of volume, 2) volume vertical thresholds, and 3) polarization levels.
The volume by itself has no reference but its own past data. This gives a short-sighted forecast.
How to use it:
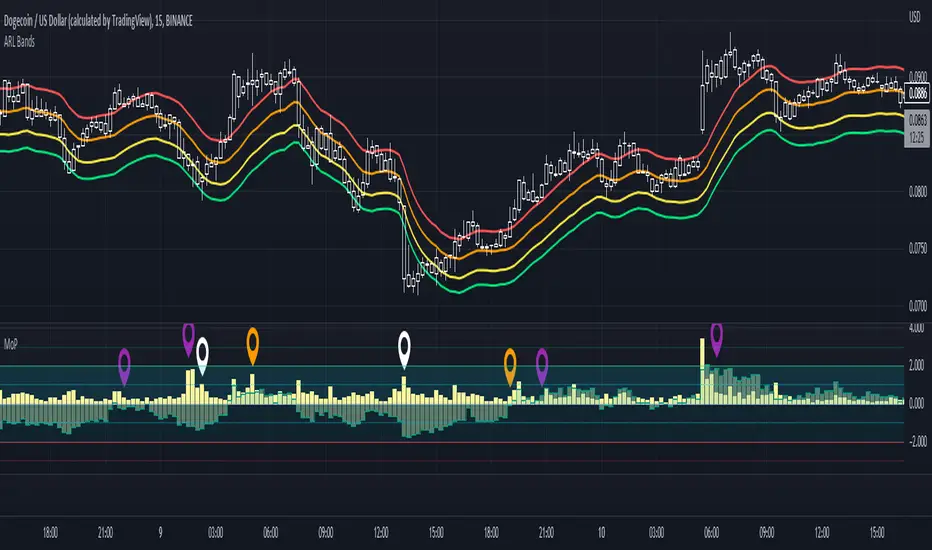
Useful with a trend finding indicator and price-action trading. See notes in picture above (scroll chart left to see first note).
Extra indicator shown in chart is an adjusted "ARL Bands".
1) A condensing of volume and polarization usually means that an uptrend will soon turn.
2) A widening of volume and polarization usually means that a downtrend will soon turn.
3) A weak uptrend is indicated when volume falls while low, positive polarization also falls.
4) A growing uptrend is indicated when volume and positive polarization grow together.
5) Overlapping volume and positive polarization usually signifies oncoming peaks.
The "Polarization" shows how much negativity or positivity the movement of the price and volume have.
IMPORTANT:
Use with crypto currencies only is highly recommended.
If the volume in a currency is not visible, adjust the "Factor" number higher in the "Inputs" tab.
Adjust it until there is a balance between the vertical spread of the volume and polarization.
There will be a noticeable jump in the scale of the indicator if it is set too high.
The "Factor" is scaled at a baseline for SHIB prices. Any lower price scales than SHIB's will not show the volume .
Version:
This is a forked codebase to conserve the functionality of "RSI TV". The "RSI TV" focuses only on the RSI trend, this focuses on price and volume movement.
As such, there is no need for the MA of the RSI. Also, the TV Line from the "RSI TV" is used to show polarization of movement in this context.
The Trend Veracity line from the "RSI TV" has a broad scope in verifying different, particular trends, not just the RSI trend.
The RSI, volume, and polarization are all conveniently placed within the same scale to facilitate longer-term trading with price action. See also: "RSI TV".
How this indicator is original; what it does, and how it does it:
This indicator has an original, unique ability to give the volume a further-projecting forecast.
The MoP does this by placing the volume on a vertical scale. It then compares it to a polarization level.
This gives 3 reference points: 1) Past data of volume, 2) volume vertical thresholds, and 3) polarization levels.
The volume by itself has no reference but its own past data. This gives a short-sighted forecast.
How to use it:
Useful with a trend finding indicator and price-action trading. See notes in picture above (scroll chart left to see first note).
Extra indicator shown in chart is an adjusted "ARL Bands".
1) A condensing of volume and polarization usually means that an uptrend will soon turn.
2) A widening of volume and polarization usually means that a downtrend will soon turn.
3) A weak uptrend is indicated when volume falls while low, positive polarization also falls.
4) A growing uptrend is indicated when volume and positive polarization grow together.
5) Overlapping volume and positive polarization usually signifies oncoming peaks.
Phát hành các Ghi chú
Updated chart to be more compliant with house rules.Mã nguồn mở
Theo đúng tinh thần TradingView, tác giả của tập lệnh này đã công bố nó dưới dạng mã nguồn mở, để các nhà giao dịch có thể xem xét và xác minh chức năng. Chúc mừng tác giả! Mặc dù bạn có thể sử dụng miễn phí, hãy nhớ rằng việc công bố lại mã phải tuân theo Nội quy.
Thông báo miễn trừ trách nhiệm
Thông tin và các ấn phẩm này không nhằm mục đích, và không cấu thành, lời khuyên hoặc khuyến nghị về tài chính, đầu tư, giao dịch hay các loại khác do TradingView cung cấp hoặc xác nhận. Đọc thêm tại Điều khoản Sử dụng.
Mã nguồn mở
Theo đúng tinh thần TradingView, tác giả của tập lệnh này đã công bố nó dưới dạng mã nguồn mở, để các nhà giao dịch có thể xem xét và xác minh chức năng. Chúc mừng tác giả! Mặc dù bạn có thể sử dụng miễn phí, hãy nhớ rằng việc công bố lại mã phải tuân theo Nội quy.
Thông báo miễn trừ trách nhiệm
Thông tin và các ấn phẩm này không nhằm mục đích, và không cấu thành, lời khuyên hoặc khuyến nghị về tài chính, đầu tư, giao dịch hay các loại khác do TradingView cung cấp hoặc xác nhận. Đọc thêm tại Điều khoản Sử dụng.