OPEN-SOURCE SCRIPT
Cập nhật Heatmapped Bollinger Bands
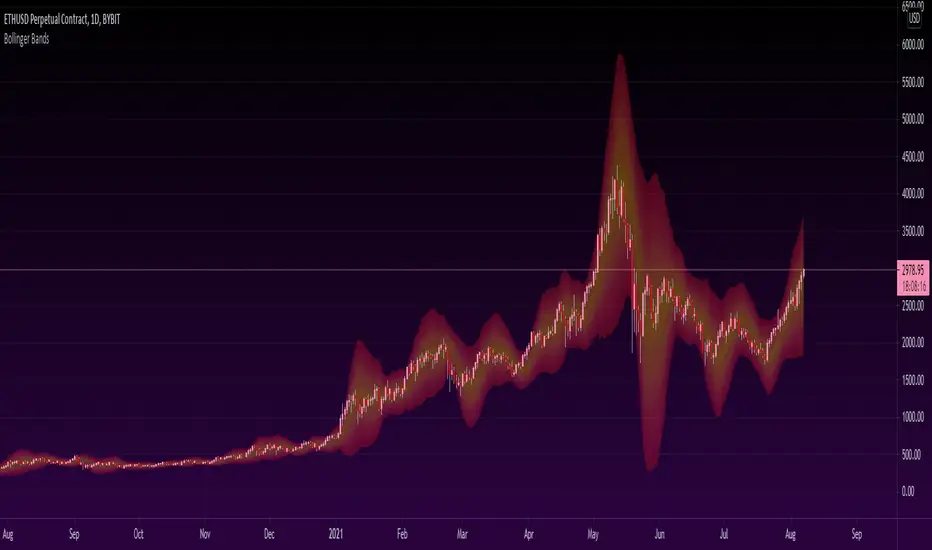
Bollinger Bands have been used for many years to determine the volatility and potential reversal area of markets. This script takes standard Bollinger Bands (BB) and transforms it into a heatmap of reversal areas.
A basic explanation on how this indicator works is:
- Yellow is where the price likes to stay,
- Orange is where the price might begin to reverse in a weak trend, and
- Red is where the price will either pause to let the yellow range catch up, or where the price will jump back down into the yellow range to stabilize.
For educational purposes: this script is essentially just taking the standard method of creating Bollinger Bands (seen in the 'Main Lines' portion of the script), coloring the plots 'na' so that they aren't seen, and using the 'fill' function to plot the yellow to red rainbow up to the top. I believe I made the yellow range 0.2*stdev to 1*stdev, the orange range 1*stdev to 2*stdev, and the red range 2*stdev to 3*stdev. You can get the hex code rainbow from any website that has a color slider.
** Disclaimer: THIS IS NOT TRADING ADVICE. Bollinger Bands should be used in conjunction with other indicators to make better decisions but NO STRATEGY IS PERFECT. Always backtest any strategy before using it live. **
Phát hành các Ghi chú
Incorrect copyright username in script after username change. Corrected to @OztheWoz.Mã nguồn mở
Theo đúng tinh thần TradingView, tác giả của tập lệnh này đã công bố nó dưới dạng mã nguồn mở, để các nhà giao dịch có thể xem xét và xác minh chức năng. Chúc mừng tác giả! Mặc dù bạn có thể sử dụng miễn phí, hãy nhớ rằng việc công bố lại mã phải tuân theo Nội quy.
Thông báo miễn trừ trách nhiệm
Thông tin và các ấn phẩm này không nhằm mục đích, và không cấu thành, lời khuyên hoặc khuyến nghị về tài chính, đầu tư, giao dịch hay các loại khác do TradingView cung cấp hoặc xác nhận. Đọc thêm tại Điều khoản Sử dụng.
Mã nguồn mở
Theo đúng tinh thần TradingView, tác giả của tập lệnh này đã công bố nó dưới dạng mã nguồn mở, để các nhà giao dịch có thể xem xét và xác minh chức năng. Chúc mừng tác giả! Mặc dù bạn có thể sử dụng miễn phí, hãy nhớ rằng việc công bố lại mã phải tuân theo Nội quy.
Thông báo miễn trừ trách nhiệm
Thông tin và các ấn phẩm này không nhằm mục đích, và không cấu thành, lời khuyên hoặc khuyến nghị về tài chính, đầu tư, giao dịch hay các loại khác do TradingView cung cấp hoặc xác nhận. Đọc thêm tại Điều khoản Sử dụng.