OPEN-SOURCE SCRIPT
Pascal's 4h Compression Breakout
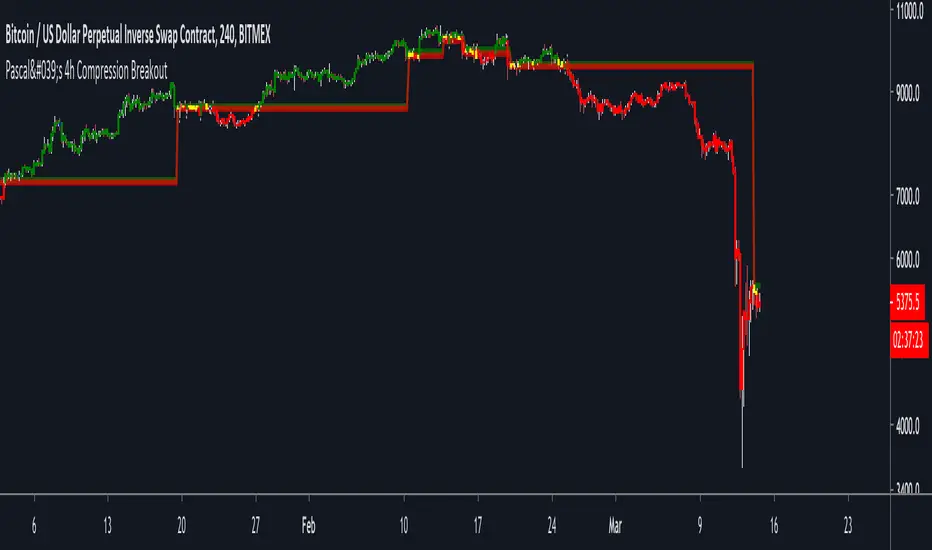
This indicator aims to identify areas of price compression, by looking for two consecutive "inside candles" on the 4h chart.
An inside candle is simply when the current candle's high is lower than the previous candle's high, and the current candle's low is higher than the previous candle's low.
Once price compression is identified, the indicator draws a range based on the highest high and the lowest low of the two inside candles.
1) A break above the range is bullish.
2) A break below the range is bearish.
The script ALSO paints candles in blue that are likely to become strong horizontal S/R levels. This is, again, based on a candle pattern.
Please note:
1) This indicator is only meant to be used on BITMEX:XBTUSD (on the 4h or 1h chart).
2) You will have to apply some discretion to profitably trade with this indicator. Use SFPs and horizontal S/R levels to judge if a breakout is worth trading.
Finally, use the indicator at your own risk. I am not responsible for any losses you may incur.
My objective with this indicator g is to hopefully give you something that you can build upon, and NOT a script to blindly copy trade.
The concept of market compression is powerful. There are countless ways in which you can build a system around it.
This is just the tip of the iceberg.
Cheers.
Mã nguồn mở
Theo đúng tinh thần TradingView, tác giả của tập lệnh này đã công bố nó dưới dạng mã nguồn mở, để các nhà giao dịch có thể xem xét và xác minh chức năng. Chúc mừng tác giả! Mặc dù bạn có thể sử dụng miễn phí, hãy nhớ rằng việc công bố lại mã phải tuân theo Nội quy.
Thông báo miễn trừ trách nhiệm
Thông tin và các ấn phẩm này không nhằm mục đích, và không cấu thành, lời khuyên hoặc khuyến nghị về tài chính, đầu tư, giao dịch hay các loại khác do TradingView cung cấp hoặc xác nhận. Đọc thêm tại Điều khoản Sử dụng.