OPEN-SOURCE SCRIPT
Genuine Liquidation Delta [Mxwll] - No Estimates
THANK YOU TradingView for allowing us to upload custom data!!!
As a result, Mxwll Capital is providing an indicator that shows REAL liquidation delta for over 100 cryptocurrencies sourced directly from a popular crypto exchange!
Features
Liquidation delta data (sourced from a popular exchange) is provided for:
How-To

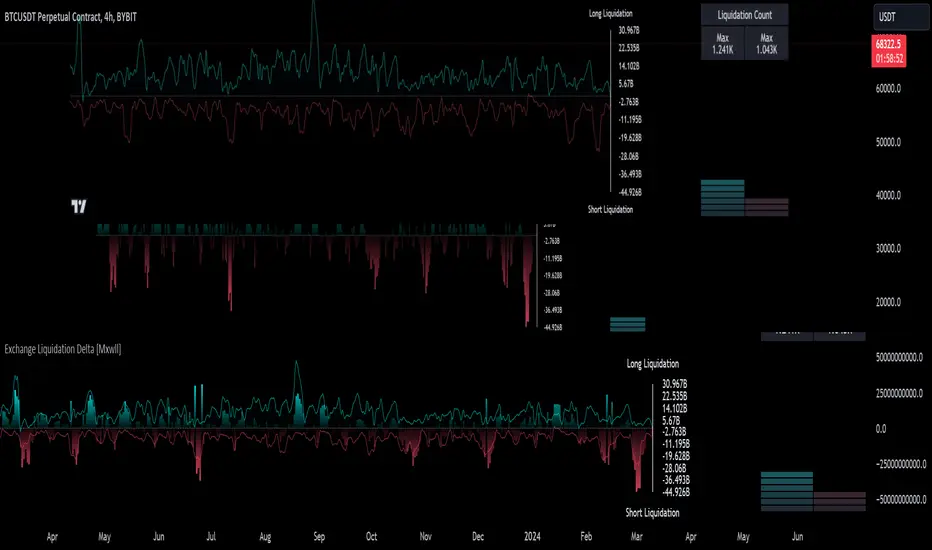
The image above shows the indicator with default settings.

The image above shows the start point of our data!
Over 2-years of data, allowing for plentiful analysis!

The image above explains the primary plot.
Filled blue columns reflect liquidation delta exceeding the long side. When the liquidation delta plot is aqua and exceeds 0 to the upside, longs were liquidated more than shorts for the
day.
Filled red columns reflect liquidation delta exceeding the short side. When the liquidation delta plot is red and exceeds 0 to the downside, shorts were liquidated more than longs for the day.

The image above explains the solid line (polyline) plot and its intentions!
Filled, solid, blue line reflects the total number of long liquidation events for the period.
Filled, solid, red line reflects the total number of short liquidation events for the period.
Keep in mind that the total number of liquidation events is normalized to plot alongside the total liquidation delta for the day. So, there aren't "millions" of liquidation events taking place, the total liquidation count for the long and short side is simply normalized to fit atop total liquidation delta.

The image above explains the liquidation count meter the indicator provides!
The left (blue columns) reflect the intensity of long liquidation events for the day. The right (red columns) reflect the intensity of short liquidation events for the day.
The "Max" numbers at the top show the maximum number of long liquidation events, or short liquidation events, for their respective columns.
Therefore, if the number of long liquidation events were "1.241k", as stated for this cryptocurrency in the table, the blue meter would be full. Similar logic applies to the red meter.

Once more, THANK YOU TradingView and PineCoders for allowing us to upload custom data! This project wouldn't be possible without it!
As a result, Mxwll Capital is providing an indicator that shows REAL liquidation delta for over 100 cryptocurrencies sourced directly from a popular crypto exchange!
Features
- Crypto exchange sourced liquidation delta
- Crypto exchange sourced long liquidation daily count
- Crypto exchange sourced short liquidation daily count
- All provided data extends back 2 years!!
- Various aesthetic components to illustrate data
Liquidation delta data (sourced from a popular exchange) is provided for:
- 1000shib
- aave
- ada
- algo
- alice
- arb
- audio
- alpha
- ankr
- ape
- apt
- atom
- avax
- axs
- bal
- band
- bat
- bch
- bel
- blz
- blur
- bnb
- bnx
- btc
- chr
- chz
- comp
- coti
- crv
- ctk
- dash
- defi
- doge
- dot
- dydx
- edu
- egld
- enj
- ens
- eos
- etc
- eth
- fil
- flm
- ftm
- fxs
- gala
- gmx
- grt
- hbar
- hnt
- icx
- id
- inj
- iost
- iota
- joe
- kava
- knc
- ksm
- ldo
- lina
- link
- lit
- lrc
- ltc
- mana
- mask
- matic
- mkr
- near
- neo
- ocean
- omg
- one
- ont
- op
- people
- qtum
- reef
- ren
- rndr
- rose
- rlc
- rsr
- rune
- rvn
- sand
- sfp
- skl
- snx
- sol
- stmx
- storj
- sui
- sushi
- sxp
- theta
- tomo
- trb
- trx
- unfi
- uni
- vet
- waves
- xem
- xlm
- xmr
- xrp
- xtz
- yfi
- zec
- zen
- zil
- zrx
How-To
The image above shows the indicator with default settings.
The image above shows the start point of our data!
Over 2-years of data, allowing for plentiful analysis!
The image above explains the primary plot.
Filled blue columns reflect liquidation delta exceeding the long side. When the liquidation delta plot is aqua and exceeds 0 to the upside, longs were liquidated more than shorts for the
day.
Filled red columns reflect liquidation delta exceeding the short side. When the liquidation delta plot is red and exceeds 0 to the downside, shorts were liquidated more than longs for the day.
The image above explains the solid line (polyline) plot and its intentions!
Filled, solid, blue line reflects the total number of long liquidation events for the period.
Filled, solid, red line reflects the total number of short liquidation events for the period.
Keep in mind that the total number of liquidation events is normalized to plot alongside the total liquidation delta for the day. So, there aren't "millions" of liquidation events taking place, the total liquidation count for the long and short side is simply normalized to fit atop total liquidation delta.
The image above explains the liquidation count meter the indicator provides!
The left (blue columns) reflect the intensity of long liquidation events for the day. The right (red columns) reflect the intensity of short liquidation events for the day.
The "Max" numbers at the top show the maximum number of long liquidation events, or short liquidation events, for their respective columns.
Therefore, if the number of long liquidation events were "1.241k", as stated for this cryptocurrency in the table, the blue meter would be full. Similar logic applies to the red meter.
Once more, THANK YOU TradingView and PineCoders for allowing us to upload custom data! This project wouldn't be possible without it!
Mã nguồn mở
Theo đúng tinh thần TradingView, tác giả của tập lệnh này đã công bố nó dưới dạng mã nguồn mở, để các nhà giao dịch có thể xem xét và xác minh chức năng. Chúc mừng tác giả! Mặc dù bạn có thể sử dụng miễn phí, hãy nhớ rằng việc công bố lại mã phải tuân theo Nội quy.
Thông báo miễn trừ trách nhiệm
Thông tin và các ấn phẩm này không nhằm mục đích, và không cấu thành, lời khuyên hoặc khuyến nghị về tài chính, đầu tư, giao dịch hay các loại khác do TradingView cung cấp hoặc xác nhận. Đọc thêm tại Điều khoản Sử dụng.