[blackcat] L5 Alchemy Gold (ALGOLD)
It is shaping up to be quite comprehensive. It includes:
- - An adaptive filter for smoothing price and volume data.
- - A volatility filter based on Average True Range (ATR).
- - A trigger moving average for generating smoothed price information.
- - An ALMA (Arnaud Legoux Moving Average) for further filtering of price and volume.
- - A divergence detector to identify potential trend reversals.
Entry Criteria: A composite crossover and crossunder of the fast and slow lines of the ALGOLD oscillator.
Exit Criteria: A crossover and crossunder of the fast and slow lines of the ALGOLD oscillator, but using a lower time frame for more sensitivity.
The input parameters of "[blackcat] L5 Alchemy Gold (ALGOLD)" indicator, are categorized into three groups:
Group 1, Alchemy Setting:
- Alchemy Sharpness (Default: 7) - Controls the sharpness of the adaptive filter.
- Alchemy Period (Default: 55) - Determines the smoothness of the oscillator.
Group 2, DVATAR Setting:
- DVATR Length (Default: 11) - Sets the period length for the DVATR, similar to ATR's Length.
- DVATR Threshold (Default: 0.07) - Adjusts sensitivity for sideways market detection.
- Smooth Length (Default: 21) - Smoothens the DVATR output, balancing with volatility detection.
Group 3, Divergence Setting:
- Parameters like Pivot Lookback, Max/Min of Lookback Range - Sets the sensitivity for divergence detection.
- Options to enable or disable plots for various types of divergence (Bullish, Hidden Bullish, Bearish, Hidden Bearish).
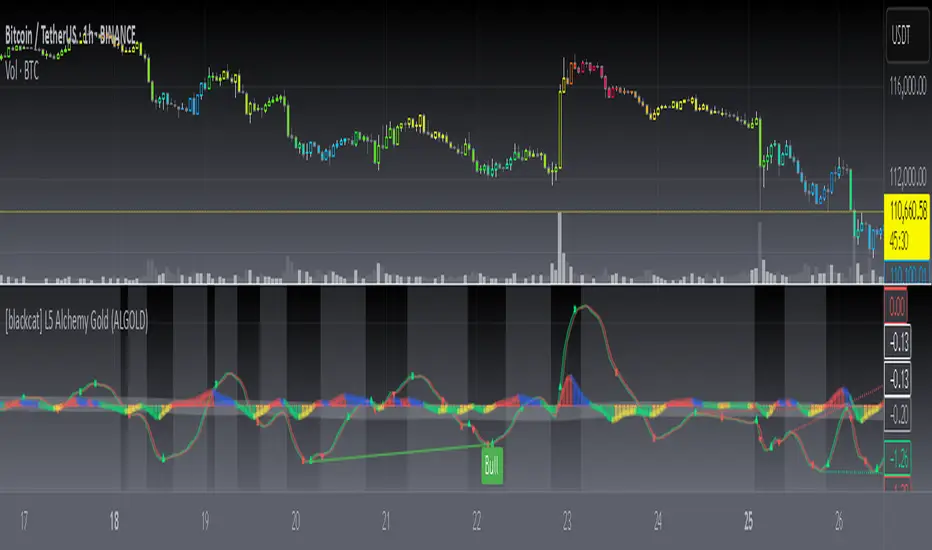
"[blackcat] L5 Alchemy Gold (ALGOLD)" indicator are vivid and intuitive:
Candle Bar Color:
Gradient color changes to indicate trend strength, with warmer colors for bullish and cooler colors for bearish trends.
Line Colors and Shapes:
- Green color represents the fast line, red for the slow line.
- Crosses of these lines signal entries (triangles) and exits (cross shapes).
- A band is created between these lines, filled with green for uptrends and red for downtrends.
Histogram:
- Red histogram for above 0 and uptrend.
- Blue histogram for above 0 and retracement.
- Green histogram for below 0 and downtrend.
- Yellow histogram for below 0 and bounce-up.
Tập lệnh chỉ hiển thị cho người được mời
Chỉ những người dùng được tác giả chấp thuận mới có thể truy cập tập lệnh này. Bạn sẽ cần yêu cầu và được cấp quyền sử dụng. Thông thường quyền này được cấp sau khi thanh toán. Để biết thêm chi tiết, làm theo hướng dẫn của tác giả bên dưới hoặc liên hệ trực tiếp với blackcat1402.
TradingView KHÔNG khuyến nghị bạn trả phí hoặc sử dụng một tập lệnh trừ khi bạn hoàn toàn tin tưởng vào tác giả và hiểu cách hoạt động của tập lệnh. Bạn cũng có thể tìm các lựa chọn miễn phí, mã nguồn mở trong các script cộng đồng của chúng tôi.
Hướng dẫn của tác giả
Thông báo miễn trừ trách nhiệm
Tập lệnh chỉ hiển thị cho người được mời
Chỉ những người dùng được tác giả chấp thuận mới có thể truy cập tập lệnh này. Bạn sẽ cần yêu cầu và được cấp quyền sử dụng. Thông thường quyền này được cấp sau khi thanh toán. Để biết thêm chi tiết, làm theo hướng dẫn của tác giả bên dưới hoặc liên hệ trực tiếp với blackcat1402.
TradingView KHÔNG khuyến nghị bạn trả phí hoặc sử dụng một tập lệnh trừ khi bạn hoàn toàn tin tưởng vào tác giả và hiểu cách hoạt động của tập lệnh. Bạn cũng có thể tìm các lựa chọn miễn phí, mã nguồn mở trong các script cộng đồng của chúng tôi.