OPEN-SOURCE SCRIPT
Dynamic CAGR Line
Indicator: Dynamic CAGR Line
Overview
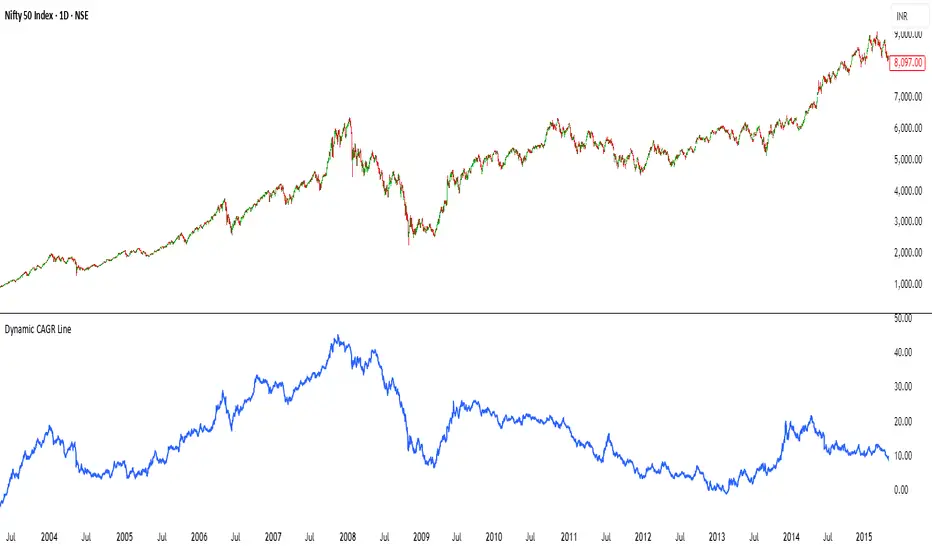
This Pine Script (version 6) creates a custom indicator called "Dynamic CAGR Moving Line," designed to calculate and display the Compound Annual Growth Rate (CAGR) in percentage terms for a financial instrument, such as a stock or cryptocurrency, based on a user-defined lookback period (default: 5 years). Unlike traditional overlays that plot directly on the price chart, this indicator appears in a separate pane below the chart, providing a clear visual of how the CAGR evolves over time with each new candle.
Purpose
The indicator helps traders and investors analyze the annualized growth rate of an asset’s price over a specified historical period. By plotting the CAGR as a percentage in a separate pane, users can easily track how the growth rate changes as new price data is added, offering insights into long-term performance trends without cluttering the price chart.
How It Works
User Input:
The script begins with an input parameter, lookback_years, allowing users to define the number of years (e.g., 5) to look back for the CAGR calculation. This is a floating-point value with a minimum of 1 and a step of 0.5, adjustable via the indicator’s settings in TradingView.
Timeframe Conversion:
Assuming a daily chart, the script converts the lookback years into a number of bars using bars_per_year = 252 (the average number of trading days in a year). The total lookback period in bars is calculated as lookback_bars = math.round(lookback_years * bars_per_year). For example, 5 years equals approximately 1260 bars.
Price Data:
For each candle, the start_price is fetched from the closing price lookback_bars ago (e.g., the close price from 5 years prior), using close[lookback_bars].
The end_price is the current candle’s closing price, accessed via close.
CAGR Calculation:
The total return is computed as (end_price - start_price) / start_price, measuring the percentage change from the start price to the current price.
To avoid division-by-zero errors, a conditional check ensures start_price != 0; if it is, the return defaults to 0.
The CAGR is then calculated using the formula: math.pow(1 + total_return, 1 / lookback_years) - 1, which annualizes the total return over the lookback period.
The result is converted to a percentage by multiplying by 100 (cagr_percent = cagr * 100).
Plotting:
The CAGR percentage is plotted as a blue line in a separate pane using plot(). The line only appears after enough data exists (bar_index >= lookback_bars), otherwise it plots na (not available).
A label is added for each candle, displaying the current CAGR percentage (e.g., "CAGR: 5.23%") near the plotted value, styled with a blue background and white text.
Usage
Chart Setup: Apply the indicator to a daily chart with sufficient historical data (e.g., more than 5 years for the default setting). It’s designed for daily timeframes but can be adapted for others by adjusting bars_per_year (e.g., 52 for weekly).
Interpretation: A positive CAGR (e.g., 5%) indicates annualized growth, while a negative value (e.g., -2%) shows an annualized decline. A flat line at 0% suggests no net change over the lookback period.
Customization: Adjust lookback_years in the settings to analyze different periods (e.g., 3 or 10 years).
Notes
Ensure your chart has enough data to cover the lookback period, or the line won’t appear until sufficient bars are available.
For debugging, you can temporarily plot start_price and end_price on the main chart to verify the calculation inputs.
Overview
This Pine Script (version 6) creates a custom indicator called "Dynamic CAGR Moving Line," designed to calculate and display the Compound Annual Growth Rate (CAGR) in percentage terms for a financial instrument, such as a stock or cryptocurrency, based on a user-defined lookback period (default: 5 years). Unlike traditional overlays that plot directly on the price chart, this indicator appears in a separate pane below the chart, providing a clear visual of how the CAGR evolves over time with each new candle.
Purpose
The indicator helps traders and investors analyze the annualized growth rate of an asset’s price over a specified historical period. By plotting the CAGR as a percentage in a separate pane, users can easily track how the growth rate changes as new price data is added, offering insights into long-term performance trends without cluttering the price chart.
How It Works
User Input:
The script begins with an input parameter, lookback_years, allowing users to define the number of years (e.g., 5) to look back for the CAGR calculation. This is a floating-point value with a minimum of 1 and a step of 0.5, adjustable via the indicator’s settings in TradingView.
Timeframe Conversion:
Assuming a daily chart, the script converts the lookback years into a number of bars using bars_per_year = 252 (the average number of trading days in a year). The total lookback period in bars is calculated as lookback_bars = math.round(lookback_years * bars_per_year). For example, 5 years equals approximately 1260 bars.
Price Data:
For each candle, the start_price is fetched from the closing price lookback_bars ago (e.g., the close price from 5 years prior), using close[lookback_bars].
The end_price is the current candle’s closing price, accessed via close.
CAGR Calculation:
The total return is computed as (end_price - start_price) / start_price, measuring the percentage change from the start price to the current price.
To avoid division-by-zero errors, a conditional check ensures start_price != 0; if it is, the return defaults to 0.
The CAGR is then calculated using the formula: math.pow(1 + total_return, 1 / lookback_years) - 1, which annualizes the total return over the lookback period.
The result is converted to a percentage by multiplying by 100 (cagr_percent = cagr * 100).
Plotting:
The CAGR percentage is plotted as a blue line in a separate pane using plot(). The line only appears after enough data exists (bar_index >= lookback_bars), otherwise it plots na (not available).
A label is added for each candle, displaying the current CAGR percentage (e.g., "CAGR: 5.23%") near the plotted value, styled with a blue background and white text.
Usage
Chart Setup: Apply the indicator to a daily chart with sufficient historical data (e.g., more than 5 years for the default setting). It’s designed for daily timeframes but can be adapted for others by adjusting bars_per_year (e.g., 52 for weekly).
Interpretation: A positive CAGR (e.g., 5%) indicates annualized growth, while a negative value (e.g., -2%) shows an annualized decline. A flat line at 0% suggests no net change over the lookback period.
Customization: Adjust lookback_years in the settings to analyze different periods (e.g., 3 or 10 years).
Notes
Ensure your chart has enough data to cover the lookback period, or the line won’t appear until sufficient bars are available.
For debugging, you can temporarily plot start_price and end_price on the main chart to verify the calculation inputs.
Mã nguồn mở
Theo đúng tinh thần TradingView, tác giả của tập lệnh này đã công bố nó dưới dạng mã nguồn mở, để các nhà giao dịch có thể xem xét và xác minh chức năng. Chúc mừng tác giả! Mặc dù bạn có thể sử dụng miễn phí, hãy nhớ rằng việc công bố lại mã phải tuân theo Nội quy.
Thông báo miễn trừ trách nhiệm
Thông tin và các ấn phẩm này không nhằm mục đích, và không cấu thành, lời khuyên hoặc khuyến nghị về tài chính, đầu tư, giao dịch hay các loại khác do TradingView cung cấp hoặc xác nhận. Đọc thêm tại Điều khoản Sử dụng.