OPEN-SOURCE SCRIPT
HL-D Close Fraction Oscillator | Adulari
Description:
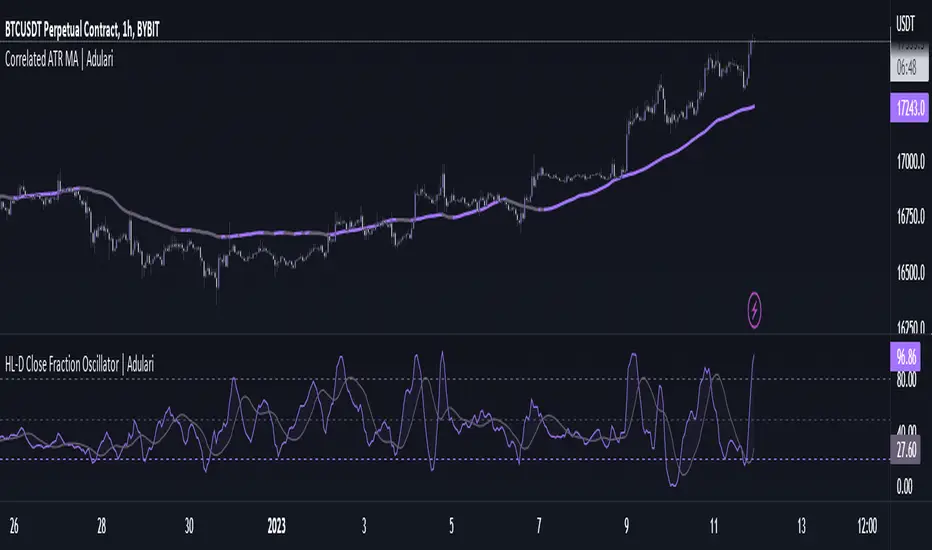
This indicator calculates the difference between price high's and low's, and fractions it by the close price. If it calculates the difference between a high and low or low and high is defined by whether the current close is higher than the previous close. It is then also rescaled to ensure the value is always appropriate compared to the last set amount of bars.
This indicator can be used to determine whether a market is trending or ranging, and if so in which direction it is trending.
How do I use it?
Features:
How does it work?
1 — Define trend by checking if current close is above or below previous close.
2 — If the current close is above the previous close, calculate the oscillator's value using this formula:
Pine Script®
2 — If the current close is below the previous close, calculate the oscillator's value using this formula:
Pine Script®
3 — Smooth the original value using a specified moving average.
4 — Rescale the value using this formula:
Pine Script®
5 — Calculate signal value by applying smoothing to the oscillator's value.
This indicator calculates the difference between price high's and low's, and fractions it by the close price. If it calculates the difference between a high and low or low and high is defined by whether the current close is higher than the previous close. It is then also rescaled to ensure the value is always appropriate compared to the last set amount of bars.
This indicator can be used to determine whether a market is trending or ranging, and if so in which direction it is trending.
How do I use it?
- Never use this indicator as standalone trading signal, it should be used as confluence.
- When the value is above the middle line this shows the bullish trend is strong.
- When the value is below the middle line this shows the bearish trend is strong.
- When the value crosses above the upper line this indicates the trend may reverse downwards.
- When the value crosses below the lower line this indicates the trend may reverse upwards.
- When the value crosses above the signal this indicates the current bearish trend is getting weak and may reverse upwards.
- When the value crosses below the signal this indicates the current bullish trend is getting weak and may reverse downwards.
Features:
- Oscillator value indicating the difference between highs and lows fractioned by the close price.
- Signal indicating a clear trend and base line value.
- Horizontal lines such as oversold, overbought and middle lines, indicating possible interest zones.
How does it work?
1 — Define trend by checking if current close is above or below previous close.
2 — If the current close is above the previous close, calculate the oscillator's value using this formula:
(high - low) / close
2 — If the current close is below the previous close, calculate the oscillator's value using this formula:
(low - high) / close
3 — Smooth the original value using a specified moving average.
4 — Rescale the value using this formula:
newMin + (newMax - newMin) * (value - oldMin) / math.max(oldMax - oldMin, 10e-10)
5 — Calculate signal value by applying smoothing to the oscillator's value.
Mã nguồn mở
Theo đúng tinh thần TradingView, tác giả của tập lệnh này đã công bố nó dưới dạng mã nguồn mở, để các nhà giao dịch có thể xem xét và xác minh chức năng. Chúc mừng tác giả! Mặc dù bạn có thể sử dụng miễn phí, hãy nhớ rằng việc công bố lại mã phải tuân theo Nội quy.
Thông báo miễn trừ trách nhiệm
Thông tin và các ấn phẩm này không nhằm mục đích, và không cấu thành, lời khuyên hoặc khuyến nghị về tài chính, đầu tư, giao dịch hay các loại khác do TradingView cung cấp hoặc xác nhận. Đọc thêm tại Điều khoản Sử dụng.