OPEN-SOURCE SCRIPT
Exhaustion Table [SpiritualHealer117]
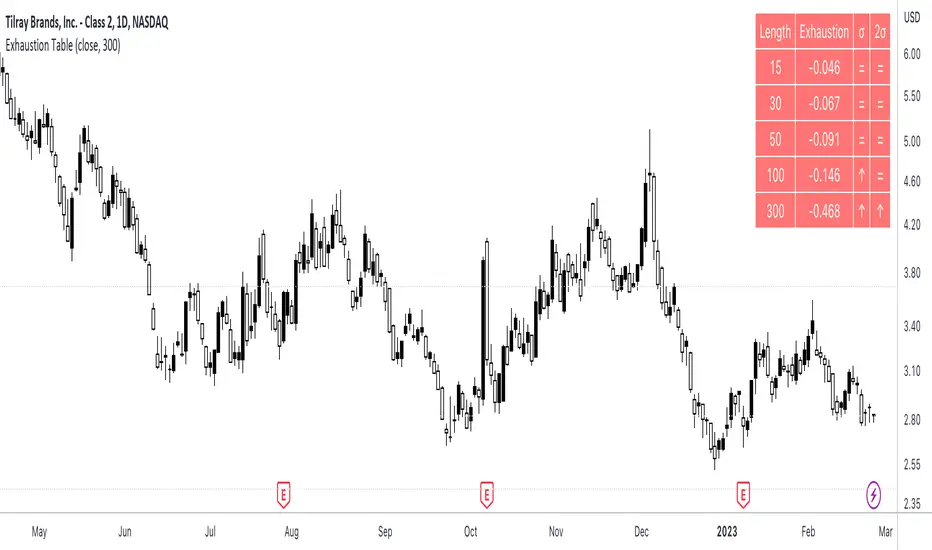
A simple indicator in a table format, is effective for determining when an individual stock or cryptocurrency is oversold or overbought.
Using the indicator
In the column "2σ", up arrows indicate that the asset is very overbought, down arrows indicate that an asset is very oversold, and an equals sign indicates that the indicator is neutral.
In the column "σ", up arrows indicate that the asset is overbought, down arrows indicate that an asset is oversold, and an equals sign indicates that the indicator is neutral.
What indicator is
The indicator shows the exhaustion (percentage gap between the closing price and a moving average) at 5 given lengths, 15, 30, 50, 100, and 300. It compares that to two thresholds for exhaustion: one standard deviation out and one two standard deviations out.
Mã nguồn mở
Theo đúng tinh thần TradingView, tác giả của tập lệnh này đã công bố nó dưới dạng mã nguồn mở, để các nhà giao dịch có thể xem xét và xác minh chức năng. Chúc mừng tác giả! Mặc dù bạn có thể sử dụng miễn phí, hãy nhớ rằng việc công bố lại mã phải tuân theo Nội quy.
Thông báo miễn trừ trách nhiệm
Thông tin và các ấn phẩm này không nhằm mục đích, và không cấu thành, lời khuyên hoặc khuyến nghị về tài chính, đầu tư, giao dịch hay các loại khác do TradingView cung cấp hoặc xác nhận. Đọc thêm tại Điều khoản Sử dụng.