OPEN-SOURCE SCRIPT
Candle Strength based on Relative Strength of EMA
Overview:
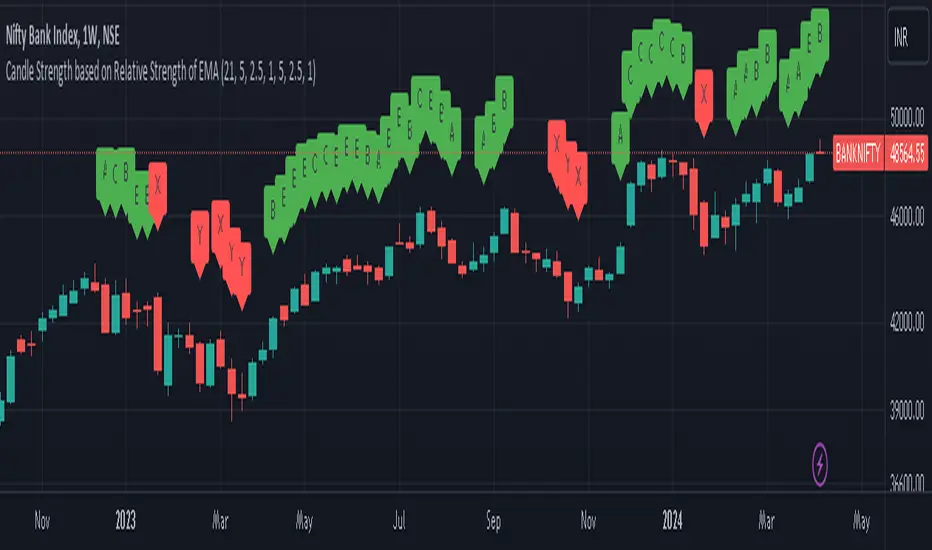
The EMA-Based Relative Strength Labels indicator provides a dynamic method to visualize the strength of price movements relative to an Exponential Moving Average (EMA). By comparing the current price to the EMA, it assigns labels (A, B, C for bullish and X, Y, Z for bearish) to candles, indicating the intensity of bullish or bearish behavior.
Key Features:
Dynamic EMA Comparison: The indicator calculates the difference between the current price and the EMA, expressing it as a percentage to determine relative strength.
Configurable Thresholds: Users can set custom thresholds for strong, moderate, and low bullish or bearish movements, allowing for tailored analysis based on personal trading strategy or market behavior.
Clear Visual Labels: Each candle is labeled directly on the chart, making it easy to spot significant price movements at a glance.
Usage:
Trend Confirmation: The labels help confirm the prevailing trend's strength, aiding traders in decision-making regarding entry or exit points.
Risk Management: By identifying the strength of the price movements, traders can better manage stop-loss placements and avoid potential false breakouts.
Strategy Development: Incorporate the indicator into trading systems to enhance strategies that depend on trend strength and momentum.
How It Works:
The script calculates the EMA of the closing prices and measures the relative strength of each candle to this average.
Bullish candles above the EMA and bearish candles below the EMA are further analyzed to determine their strength based on predefined percentage thresholds.
Labels 'A', 'B', and 'C' are assigned for varying degrees of bullish strength, while 'X', 'Y', and 'Z' denote levels of bearish intensity.
Customization:
Users can adjust the EMA period and modify the strength thresholds for both bullish and bearish conditions to suit different instruments and timeframes.
Best Practices:
Combine this indicator with volume analysis and other technical tools for comprehensive market analysis.
Regularly update the thresholds based on market volatility and personal risk tolerance to maintain the effectiveness of the labels.
Mã nguồn mở
Theo đúng tinh thần TradingView, tác giả của tập lệnh này đã công bố nó dưới dạng mã nguồn mở, để các nhà giao dịch có thể xem xét và xác minh chức năng. Chúc mừng tác giả! Mặc dù bạn có thể sử dụng miễn phí, hãy nhớ rằng việc công bố lại mã phải tuân theo Nội quy.
Thông báo miễn trừ trách nhiệm
Thông tin và các ấn phẩm này không nhằm mục đích, và không cấu thành, lời khuyên hoặc khuyến nghị về tài chính, đầu tư, giao dịch hay các loại khác do TradingView cung cấp hoặc xác nhận. Đọc thêm tại Điều khoản Sử dụng.