PROTECTED SOURCE SCRIPT
Daily SMA200 Distance - Percentile Zones
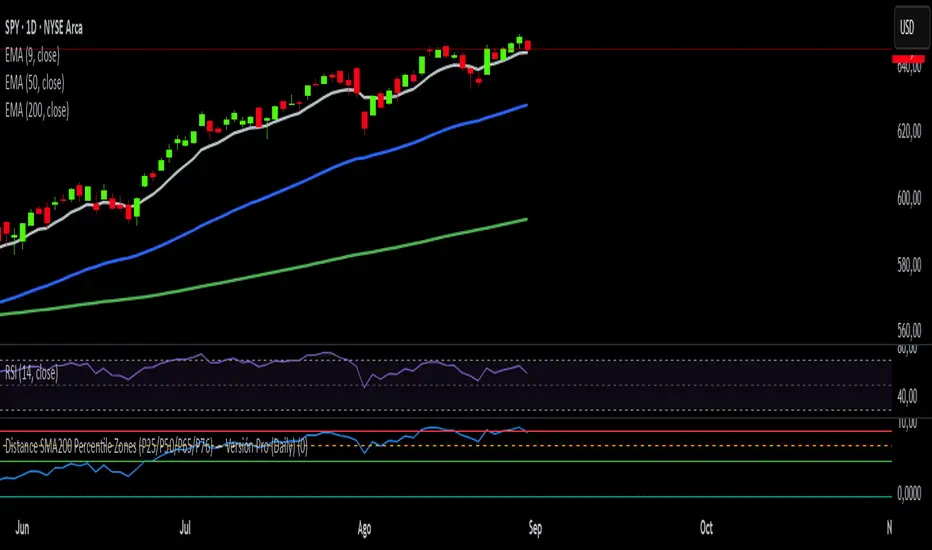
The Daily SMA200 Distance – Percentile Zones indicator measures the percentage distance of price relative to the 200-day Simple Moving Average (SMA200) and classifies it into historical percentile zones.
This tool helps identify the context of an asset in relation to its medium- to long-term trend:
Cheap Zone (< P25): price at historically low levels relative to the SMA200.
Value Zone (P25–P50): neutral range, where price trades around its medium-term average.
Acceptable Zone (P50–P65): moderately high levels, still reasonable within an uptrend.
Not Recommended Zone (P65–P76): overextended territory with rising correction risk.
Very Expensive Zone (≥ P76): extreme levels, historically linked to overvaluation and potential market tops.
Percentile calculations update dynamically with each new daily candle, providing a robust and objective statistical perspective for swing trading and portfolio management decisions.
Mã được bảo vệ
Tập lệnh này được đăng dưới dạng mã nguồn đóng. Tuy nhiên, bạn có thể tự do sử dụng tập lệnh mà không có bất kỳ hạn chế nào – tìm hiểu thêm tại đây.
Thông báo miễn trừ trách nhiệm
Thông tin và ấn phẩm không có nghĩa là và không cấu thành, tài chính, đầu tư, kinh doanh, hoặc các loại lời khuyên hoặc khuyến nghị khác được cung cấp hoặc xác nhận bởi TradingView. Đọc thêm trong Điều khoản sử dụng.